Raise your hand if you remember ROYGBIV from elementary school. Yep, the general order of colors in a rainbow: red-orange-yellow-green-blue-indigo-violet.
Now for the next question… Have you ever wondered why a banana is yellow? Yeah, a strange question I know but it is one of my talking points during lecture, so I feel compelled to mention it here… It turns out that a banana slowly changes from green to yellow as the amount of chlorophyll present diminishes. They turn brown because you didn’t eat them fast enough (also because they are, at that point, chemically different from the green and yellow fruit). The yellow appearance is due to the fact that the banana peel absorbs all colors seen in the spectrum, ahem ROYGBIV, except yellow. That yellow light bounces off the peel and finds its way to your eyes. And that, my friends, is why a banana appears yellow.
The important notion from above isn’t that a banana is yellow, but that the green fruit turns yellow and then brown because they are, at those points in time, chemically different. Since they are chemically different, they absorb and reflect different amounts of light, and those differing amounts of reflected light are why we see the varying colors!
Enough about bananas. Let’s look at my back yard. I captured an image from my back deck on a Sunday afternoon in May at around 4 pm using a Micasense RedEdge-M multispectral camera (figure 1).
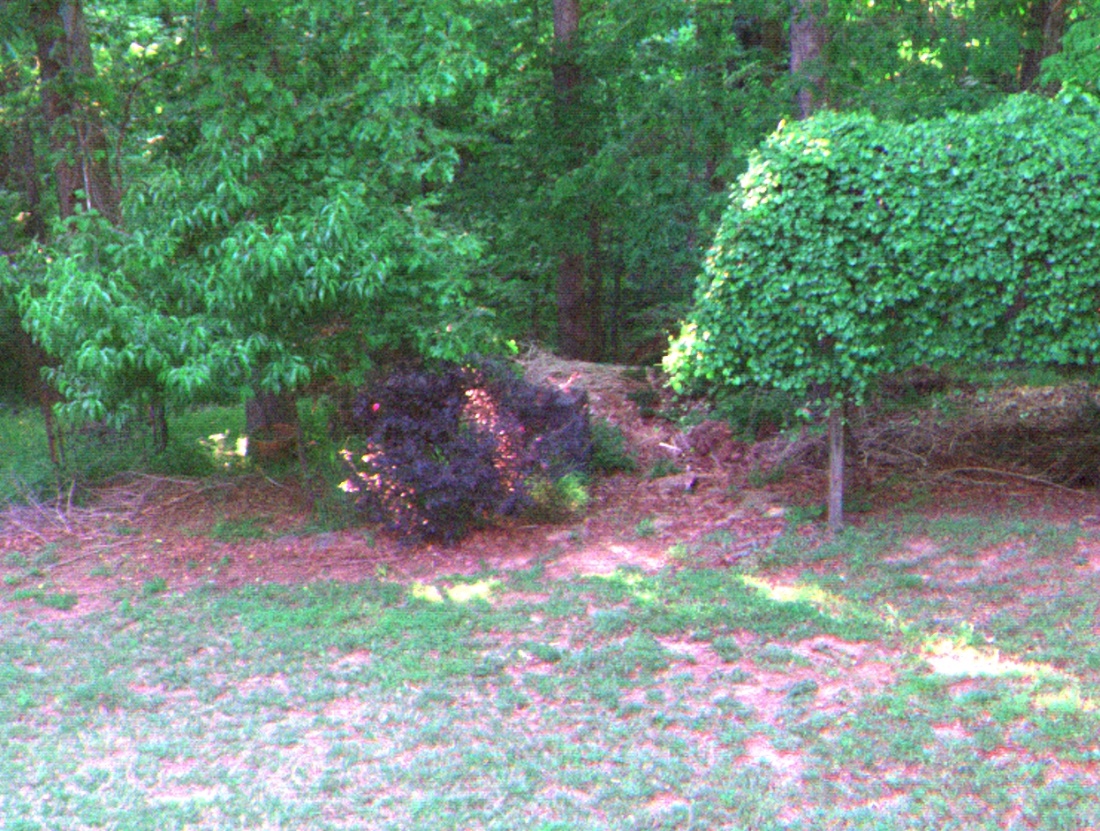
Figure 1. Color image of my back yard.
The bush centered in the image is my barberry bush. You can see the muscadine vine from which I feed the neighborhood deer off to the right. When viewed in natural color using the RGB color combination, the barberry appears purple and the muscadine appear to be green.
The RedEdge camera records the amount of light reflected off a surface in five distinct parts of the electromagnetic spectrum. The first three bands measure the reflected light in the visible blue, green, and red parts of the spectrum. This allows for the creation of color images like the one seen in figure 1. The red edge and the near-infrared, bands four and five, record reflected light in the beyond-red part of the spectrum that is not visible to the human eye (figure 2).

Figure 2. Typical response from a healthy and a stressed plant across the visible, red edge, and near-infrared portions of the electromagnetic spectrum.
It is interesting to see how the barberry and muscadine reflect light at different rates within the five Micasense RedEdge spectrum ranges (figure 3). (I have inserted larger band 1 – 5 images at the end of this note).
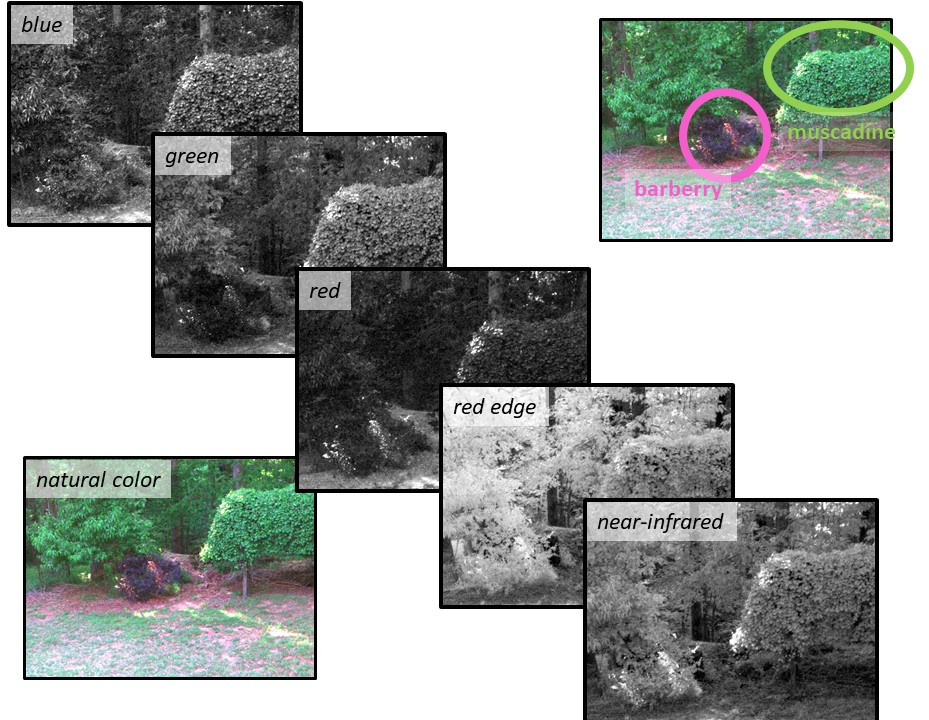
Figure 3. My barberry bush and muscadine vine as they appear in the Micasense blue, green, red, red edge, and near-infrared bands.
The lighter values in the blue image of the barberry bush (figure 3) indicate that this plant reflects more energy (light) in the blue spectrum than it does in the green AND red. The muscadine, on the other hand, reflects more energy in blue AND green spectrum than it does in the red spectrum. These are the minute differences we are looking to exploit when analyzing the landscape to, perhaps, automatically generate a vegetation map or when we want to assess a field’s internal and overall health. I could ask the computer to:
- find all of the areas within my photos whose blue values are larger than the green and red values and call them “barberry” (blue > green and red), or
- find all of the areas within my photos whose blue and green values are larger than the red and call them “muscadine” (blue and green > red).
You will certainly find areas that do not fit into this simplified model of reality. We could add to our model by including information from red edge and/or the near-infrared bands. Many times, researchers use complex combinations of these bands to create vegetation indices designed to highlight different aspects of plant growth. Maybe you have heard of the Normalized Difference Vegetation Index (NDVI) or the Soil Adjusted Vegetation Index (SAVI) or one of the many other VIs folks have found useful.
By now, I hope you are wondering why we might want to do something like this. Think back to the banana example. Let’s say that the Chiquita Brands International company categorizes their inventory as ‘too ripe’, ‘ripe in 5 days’, ‘just right’, and ‘rotten in 5 days’. With relative ease, they could determine the amount of energy each group reflects and use that data to create a spectral response curve like the one seen in figure 2. They could then scan their inventory with a multispectral scanner and determine which batch they should be sent out immediately, the ‘rotten in 2 days’ group of course, and which ones should stay in storage for a couple more days.
In a forest management setting, we might be interested in finding those trees that are in decline due to an insect infestation. Trees in this state reach a point where chlorophyll production slows and their spectral characteristics begin to deviate from the norm. Sounds like a research project, doesn’t it… Any takers?
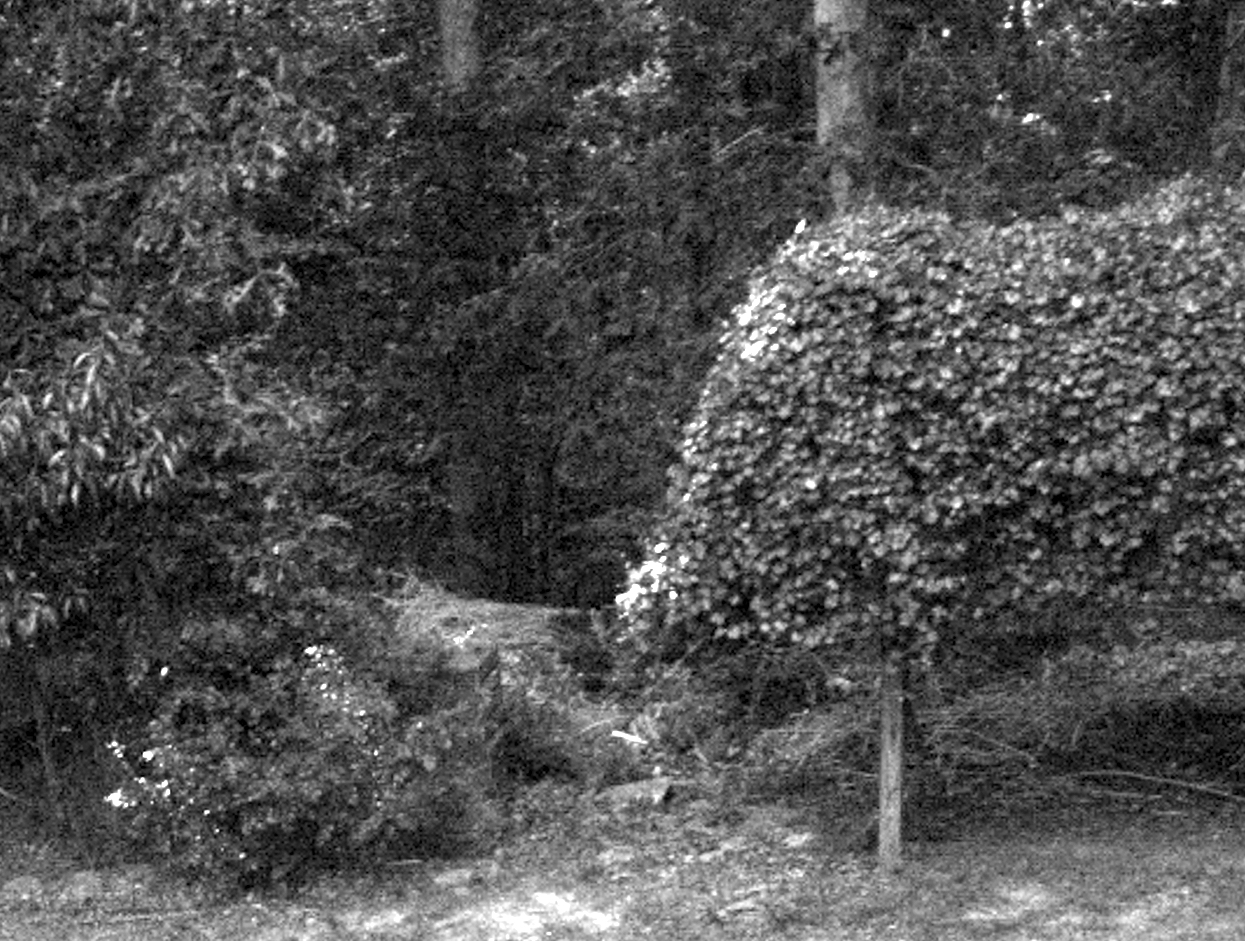
Figure 4. Micasense RedEdge blue band.
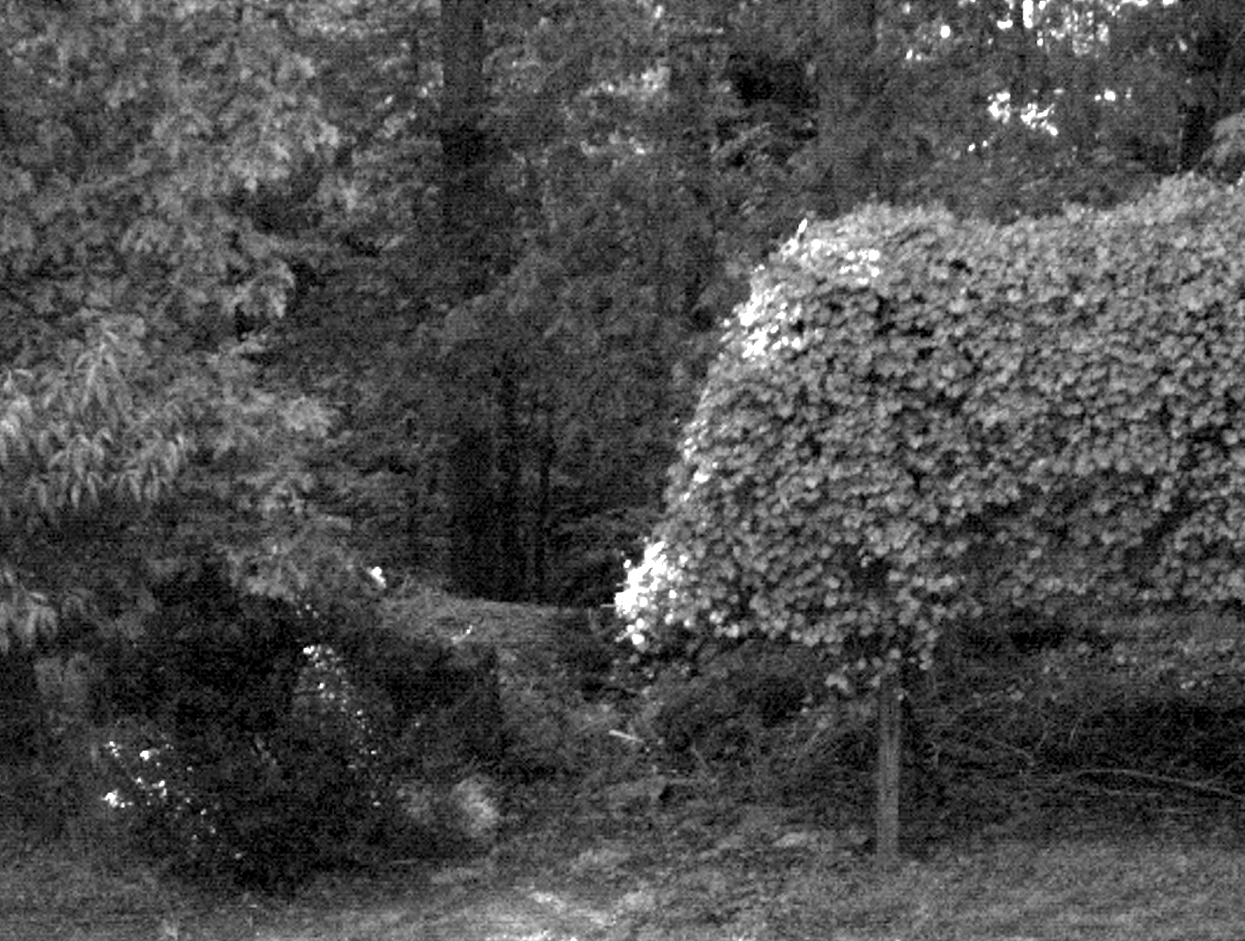
Figure 5. Micasense RedEdge green band.
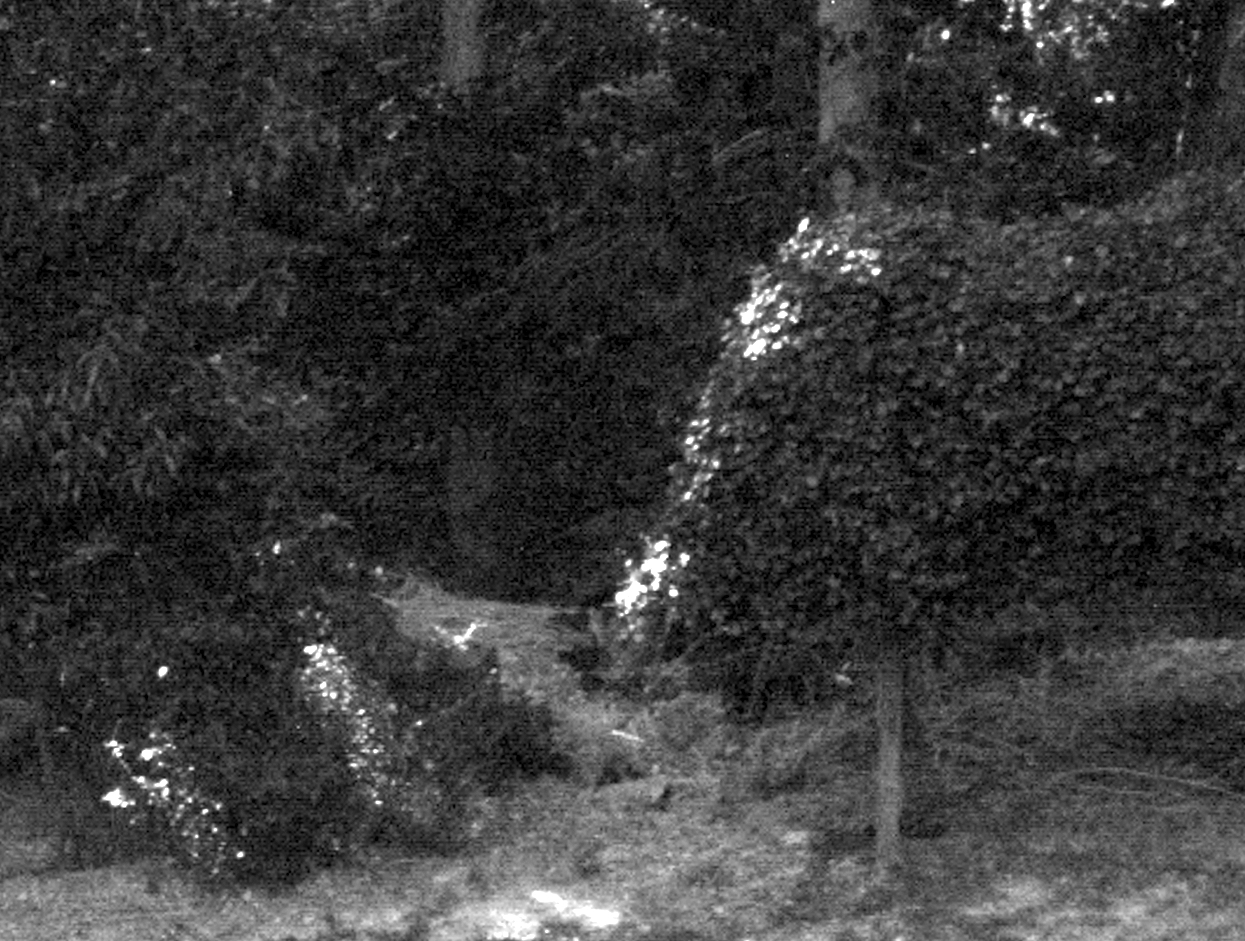
Figure 6. Micasense RedEdge red band.
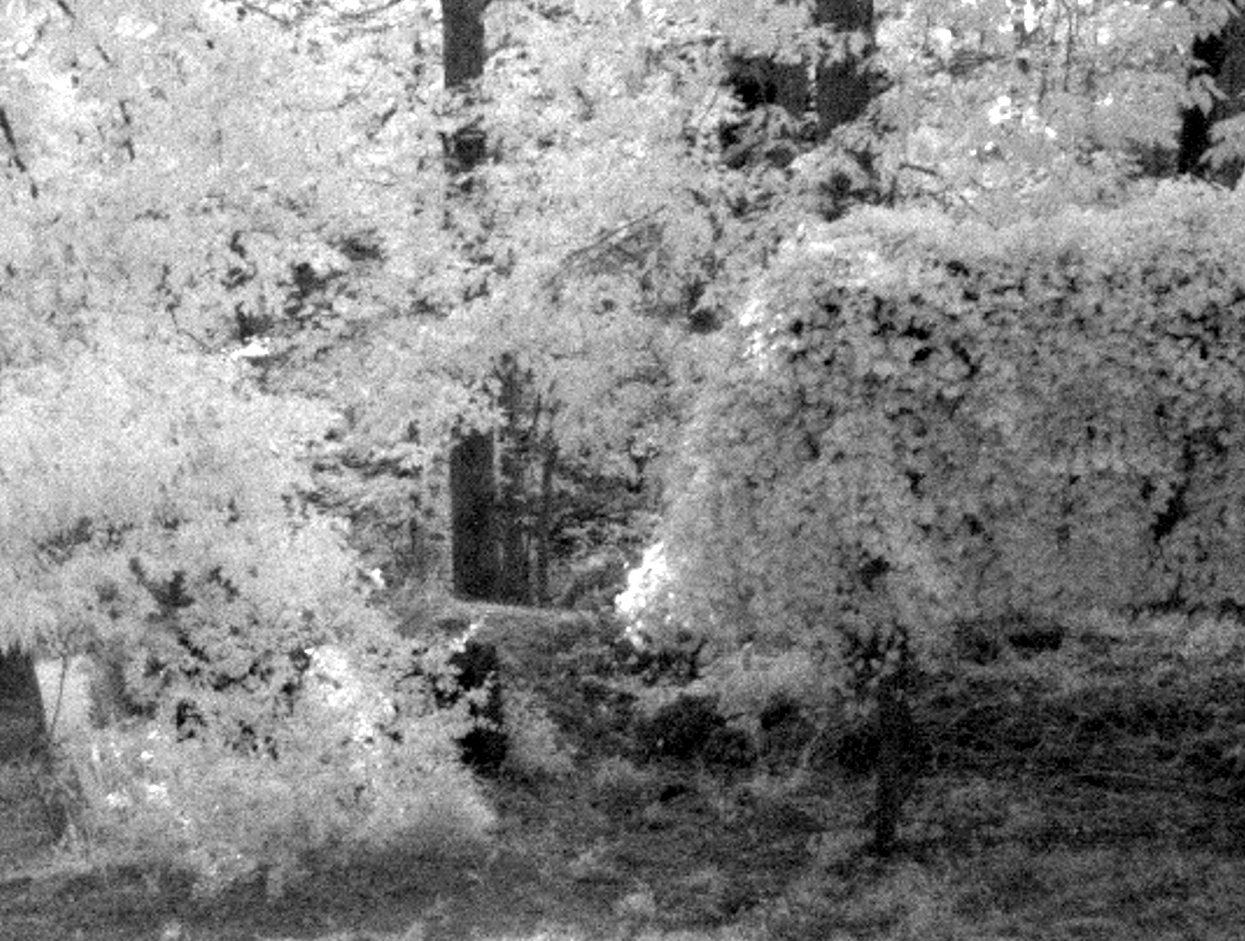
Figure 7. Micasense RedEdge red edge band.
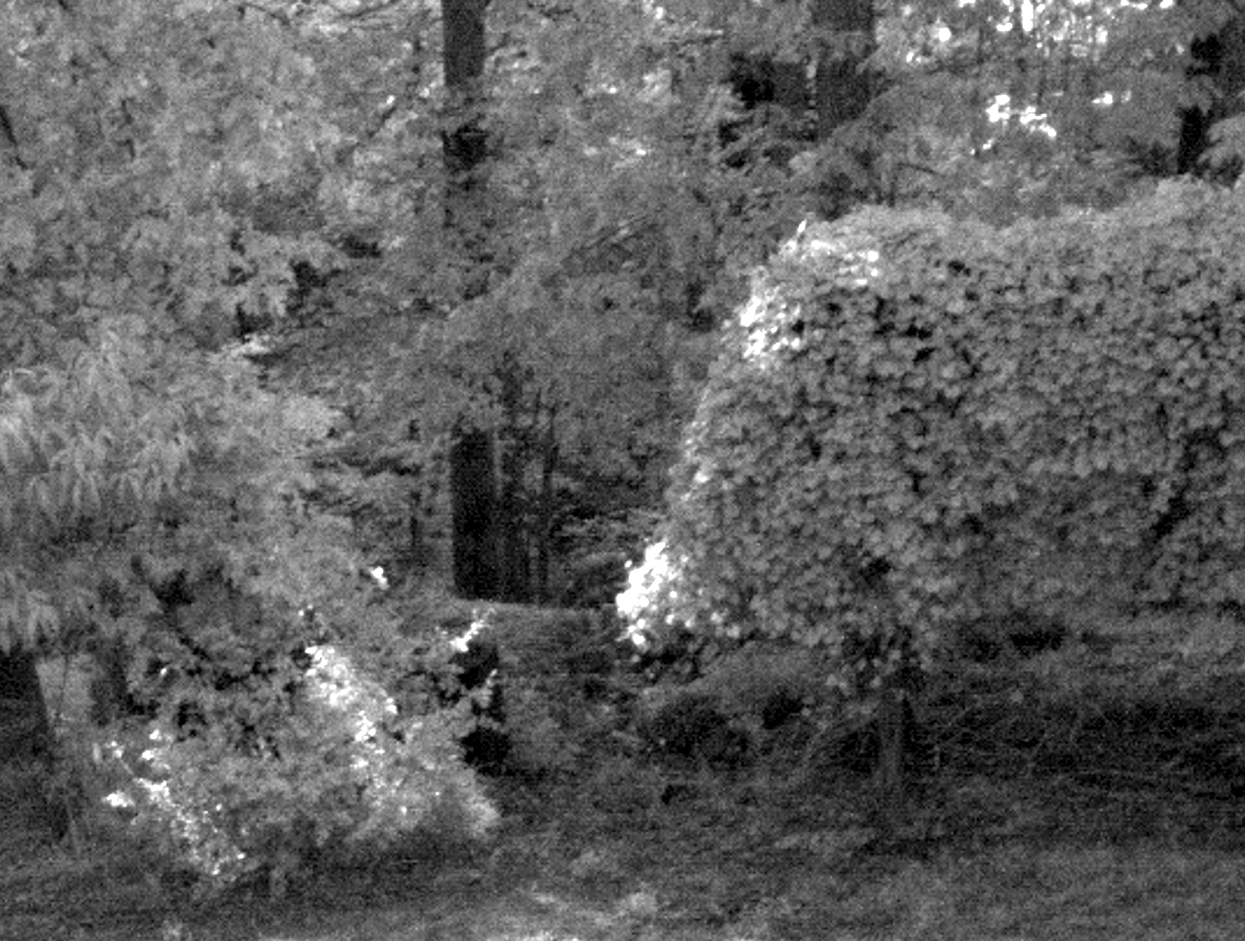
Figure 8. Micasense RedEdge near-infrared band.

Figure 9. False-color red edge combination (red edge, green, blue).

Figure 10. Traditional false-color infra-red combination (near-infrared, red, green).