Review of Lab 2.
- Updating Geometry (calculating acres)… Often times, a client will send you a GIS layer they created and it will most likely already have an area field. Sometimes you will see two measurements; a SurveyArea field and a GISArea field. It costs YOU very little in time and effort to check these measures. Add a field and calculate area, perimeter, or length yourself. I always prefix my geometry fields with “tlo” (tloacres, tloperimeter, tlolength, etc) so I can easily differentiate between measurements I generate in the GIS and fields that already exist in the layer.
- Add a field: Open the attribute table > Table Options > Add Field
- Calculate geometry (area, length, etc): Open the attribute table > right-click on the field you just added > Calculate Geometry
- Selected records and ArcMap processes… Processes in ArcMap (joining tables, a tool in the ArcToolbox, and many others) are applied to only the selected records if there are any. The process is applied to all records if there are no selections.
- Table of Contents (TOC)…
- You must “List by drawing order” before you can adjust the order in which your layers are shown
- Tables only appear when layers in the TOC are “Listed by source”
- The dissolve process… The dissolve command combines all polygons based on a user-specified field (or fields). Recall that I asked you to UNTICK the “Create Multipart Features” box in the DISSOLVE dialog. Multipart features are a representation of a place or thing that has more than one part there will be only one entry in the attribute table for this feature. Consider the eight islands that make the state of Hawaii. If the state is represented as a singlepart feature, you will have eight entries in the attribute table and you can analyze each island individually – you could determine the area and elevation changes for each island. If the state is represented as a multipart feature, then the individual polygons are considered as one with only one entry in the attribute table. As a multipart feature, you could calculate the area of Hawaii and the elevation range of Hawaii, but you could not analyze the individual islands.
- Creating your map layout…
- Ensure your geographic data is the focus of the map (right-click on the main layer in the TOC > Zoom to layer)
- Insert a title, legend, text box with your name and date (and source of data), scale bar, north arrow
- Each element you add has a right-click > properties where you can change color, style, font, etc
- Tools in the ArcToolbox… You will notice duplicate tools when you use the Search feature in ArcMap. If you have a choice between …(Data Management), and (…Coverage) use the Data Management option.
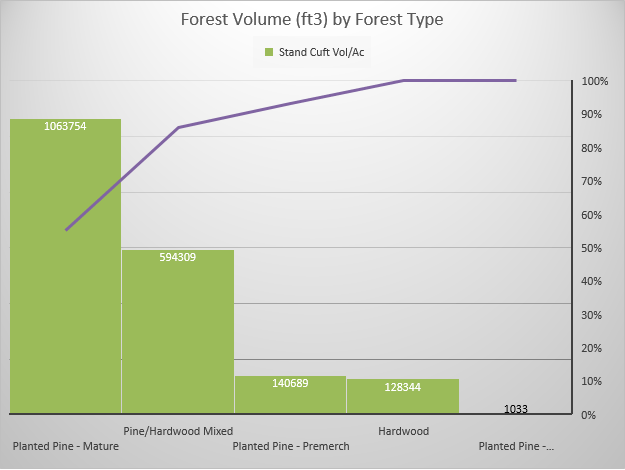
In this lab, we have a land holding that is managed on a forest-based regime. Year-end reports and maps about the area of each forest type, volume summary by forest type, and the distribution of basal area by type are among the many that are necessary. This is why you export the attribute table to a CSV for processing in your graphing software.
There is a need, however, to report similar information by compartment. Since our stand-level data contains a compartmnt identifyer, we can export the stand-level attribute table and generate pivot tables quickly in Excel. You will still need to generate the compartment GIS layer for your map outputs. Whenever you need to report on, generate a map of, or otherwise analyze your data at an aggregate resolution, use the DISSOLVE command.
A quick graph generated in Excel using the exported CompStands attribute table.