To start with, we will look at this data layer. I want to demonstrate why we might be concerned about distortion in our data due to the user’s choice of coordinate system. Have a little patience, I will release the lab data in a few minutes.
Close this project when we’re done. No need to save.
(the demo will take ~20 minutes)
Your task in this lab is to calculate the straight-line distance from Athens Georgia to a select set of cities. You will be analyzing a point shapefile I compiled called CityPoints_LatLong. You will find this file is in the CityPoints download linked on this week’s eLC page. In this lab, you will calculate each point’s X and Y coordinates using different coordinate systems (UTM17, UTM16, State Plane Georgia East, State Plane Georgia West, and Long/Lat). Some of these coordinate systems are appropriate for these areas and others are not. Your workflow for this lab is:
- add new fields to the point layer’s attribute table
- allow the GIS to calculate the X and Y coordinates of each city using the different coordinate systems
- at the end of the lab, you will have calculated a city’s the X and Y coordinates using 5 different coordinate systems
- while the actual X and Y values differ, they each reference the same location on the earth (they are different values b/c they are using different coordinate systems)
- export the attribute table to EXCEL and manually calculate the distances from each city to all other cities
STEP 1: add fields to the attribute table (eLC Video: ArcGIS Pro – Add fields to attribute table)
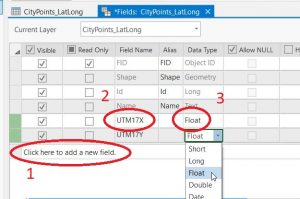
In this lab, you will calculate XY coordinate pairs for each city point using 5 different coordinate systems. Before you make the calculations, you must add fields to the attribute table to store these measurements. In all you will add 10 new float fields:
- utm17X
- utm17Y
- utm16X
- utm16Y
- gaspEX
- gaspEY
- gaspWX
- gaspWY
- longwgs84
- latwgs84
- Use the Fields View functionality in ArcPro to add your new fields (see ArdGIS Pro – Add fields… video in this week’s eLC page)
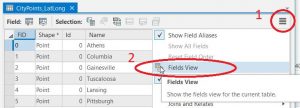
- In the Fields View, add your 10 new float fields
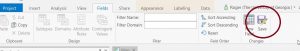
- Finally, save your additions and close the Fields View
- Closing the Fields View sends you back to your point’s attribute table.
STEP 2: Adjust the map coordinate system, calculate the X&Y coordinates and repeat for the next coordinate system
In practice, if you use the wrong coordinate system for the area in which you are working, you introduce distortion in shape, area, distance, and/or direction. In this lab, I am forcing you to determine city coordinates using 5 select coordinate systems – some are appropriate for these cities and some are not. For instance, UTM Zone 17 is appropriate for eastern Georgia and South Carolina and UTM Zone 16 is appropriate for western Georgia and Alabama. In other words, UTM Zone 17 minimizes distortion for the areas east of Atlanta and UTM Zone 16 minimizes distortion for areas west of Atlanta. Furthermore, when mapping an area, UTM Zone 15 minimizes distortion for sites in Mississippi.
You will repeat the following steps for each coordinate system (UTM Zone 17, UTM Zone 16, NAD 1927 Georgia State Plane East, NAD 1927 Georgia State Plane West, Lat/Long WGS 1984).
- Set the map view’s coordinate system
- right-click on the Map at the top of the Contents pane > Properties
- choose Coordinate Systems in the left pane
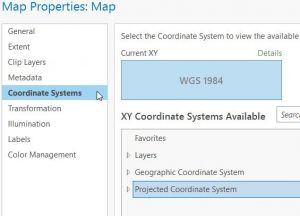
- expand the Projected Coordinate System entry
- select UTM > NAD 1983 > NAD 1983 UTM Zone 17N
- OK
- your map view coordinate system is now set to NAD 1983 UTM Zone 17N
- this coordinate system is ideal for mapping projects east of Atlanta
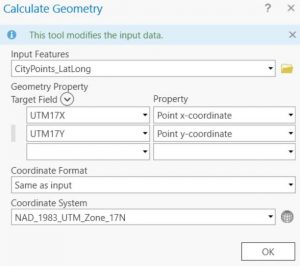
- Calculate the cities UTM17 X and Y coordinates
- from the attribute table, right-click on the UTM17X field > Calculate Geometry
- Input Features: CityPoints_LatLong
- Target Field / Property: UTM17X / Point x-coordinate
- Target Field / Property: UTM17Y / Point y-coordinate
- Coordinate Format: Same as input
- Coordinate System: Current Map [Map]
- OK
- NOTICE that you can specify your target coordinate system in this dialog by clicking on the World icon and drilling down to the coordinate system of your choice. (Alternatively, you can go back to your Map view, change the Map’s coordinate system; go back to the Calculate Geometry dialog and select Same as Map…)
- from the attribute table, right-click on the UTM17X field > Calculate Geometry
- Repeat for
- NAD 1983 UTM Zone 16N,
- NAD 1927 Georgia State Plane East (Projected Coordinate System > State Plane > NAD 1927 (US Feet) > NAD 1927 StatePlane Georgia East FIPS 1001)
- NAD 1927 Georgia State Plane West (Projected Coordinate System > State Plane > NAD 1927 (US FEET) > NAD 1927 StatePlane Georgia West FIPS 1002)
- Lat/Lon (Geographic Coordinate System > World > WGS 1984)
- Export your attribute table as a CSV
- From your attribute table > Table Options > Export
- Output Location: make sure you point to your working directory, NOT the home file geodatabase
- Output Name: call this new file “citycoordinates.csv”
- From your attribute table > Table Options > Export
- Open your exported CSV in Excel
- Use Pythagorean’s Theorem to determine the UTM 17, UTM 16, Georgia State Plane East, Georgia State Plane West distances from ATHENS to all other cities, Lat/Long (Google it if you don’t know)
- NOTE: UTM measurements are in METERS, State Plane measurements are in FEET, Lat/Long measurements are in DECIMAL DEGREES
PLEASE UNDERSTAND THAT IN THIS LAB, THE CONCEPT OF DISTORTION DUE TO YOUR SELECTION OF COORDINATE SYSTEM IS DEMONSTRATED USING POINTS AND DISTANCE. YOU WILL EXPERIENCE THE SAME DISTORTION IN AREA MEASUREMENTS AND DIRECTION MEASUREMENTS AND SCALE MEASUREMENTS IF YOUR SELECTION OF COORDINATE SYSTEM IS UNWISE.
LAB 4 QUESTIONS (1 – 7, reference lecture materials) (8 – 10, reference your Excel table)
- What UTM zone should I use if I am creating GIS data for the state of Alabama?
- What UTM zone should I use if I am creating GIS data for a site in western Idaho?
- What UTM zone should I use if I am creating GIS data for a site in eastern Idaho?
- Assume you are working along the Mississippi/Alabama border.
- What UTM zone should you be working in?
- At this site, would your easting value (the X coordinate) be larger than 500,000m or smaller than 500,000m?
- What does a UTM northing value (the Y coordinate) of 3,000,000m mean?
- What State Plane zone should you use if your site is in eastern Georgia?
- The State Plane zones for some states are oriented in a north-south direction and others are oriented in an east-west direction. Why are the state plane zones established in this manner?
- Consider the four Athens-to-Pittsburgh distances (UTM17, UTM16, SPGaEast, SPGaWest). Which measurement would you present as the most accurate? Please tell me why you made this decision?
- Why are the Lat/Long distance measurements nonsense?
- Create and insert a table that presents the results from your Athens-to-city distances. The table should contain the to-city, utm17-distance, utm16-distance, SPGaE-distance, SPGaW-distance, and the decimal degree distance. Round your values to the nearest ones except the lat/lon. Format your table like the one below. You have one line at the top and bottom of the table, one line below the field names – NO other lines or colors (PLEASE NOTE: use the format of this table, not the values – the information shown in this table are not the answers to this question!!!)
- If you create your table in Excel, among other formatting tasks, make sure you
- round values appropriately,
- left justify text,
- center numeric values,
- check spelling, and
- change the fill color to white before you copy/paste it into your Word document.
- If you create your table in Excel, among other formatting tasks, make sure you
Insert your answers for questions 1 – 10 into a Word document, insert your properly formatted EXCEL table into an empty page of that Word document and upload it this week’s eLC assignment folder. Also, make sure you upload this week’s ESRI.COM/Training certificate.