Base your answers on the RCW dataset in ELC.
Attribute table information:
- baac: basal area per acre (ft2)
- cuft: cubic foot volume per acre (ft3)
- age2018: December 31, 2018 age
(For this exercise, assume you are generating a report for December 31, 2019)
- Produce a histogram of ages for the combined ‘evergreen forest’, ‘deciduous forest’, and ‘mixed forest’ stands. Use 5-year age classes (0 to 5; 5 to 10; 10 to 16; …). Looking for a
professionalvery nice graph; please format your histogram (colors, label axes, title, etc). If you are unsure, GOOGLE “examples of quality histograms” - Generate a summary table showing the mean age, mean basal area, and total cuft volume for each individual cover type for stands 25 acres and larger. Use the following table formatting and ensure types are shown as the rows, statistics along the columns (looking for a
professionalvery nice quality table):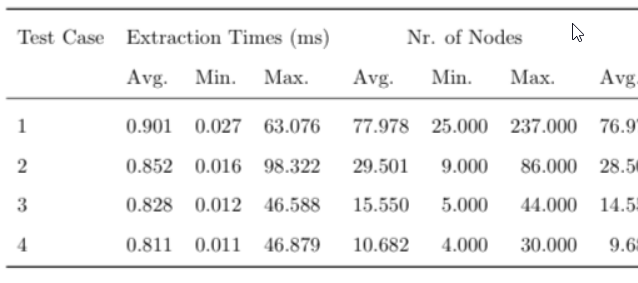
- Generate a summary table showing the mean age, mean basal area, mean cuft volume per acre, and total volume of each individual stand type of stands that are adjacent (within 10m) to open water. Format your summary table using the above format.
FLIP GRID assignment: Give me a short explanation (< 1.5 minutes) of how the coordinate system YOU selected for the lab 4 analyses affect your answer. Specifically, tell me 1) what coordinate system you used and how (or why) you decided to use it and 2) how you think your answers might differ if you chose the wrong one. (Yes I am expecting you to recall the lessons learned from last week’s lab). Lab 4 FLIPGRID assignment address: https://flipgrid.com/fc8265 (password fanr3800)