In today's demonstration, I will walk you through the process of joining an Evalidator query result to a data layer in ArcMap. We will use the Evalidator reports and the 2015 Census county boundaries in this
.
While the context of my example today may or may not be relevant to your interests, you need to understand why you need to perform each step since the process of joining the summary results of a timber cruise to a GIS data layer are identical to the process of joining the number of bird observed along transect sample site! The general process is as follows:
- Determine your common ID field in your GIS data layer
- is it numeric or text
- are there any foreseeable issues (De Kalb vs DeKalb vs Dekalb, or 0122 vs 122)
- while it is OK to have duplicate common IDs in the layer to which you will join the data, you need to make sure this is what you want
- Find/prepare your common ID field in your external tabular data layer
- ensure its CID field has the same type
- ensure all foreseeable issues are addressed
- ensure you have NO duplicate CIDs in this external tabular data layer – technically it is possible to join multiple records from the external table to the GIS data layer – YOU DO NOT WANT TO DO THIS!!!
Useful EXCEL VBA Commands:
Most of these commands work in EXCEL and ArcGIS Field Calculator. ESRI support has a nice description of these commands in the context of the Field Calculator here and some examples here.
- left: The Microsoft Excel LEFT function allows you to extract a substring from a string, starting from the left-most character.
LEFT( text, [number_of_characters] )
- right: The Microsoft Excel RIGHT function extracts a substring from a string starting from the right-most character.
RIGHT( text, [number_of_characters] )
- mid: The Microsoft Excel MID function extracts a substring from a string (starting at any position).
MID( text, start_position, number_of_characters )
- len: The Microsoft Excel LEN function returns the length of the specified string.
LEN( text )
- find – EXCEL: The Microsoft Excel FIND function returns the location of a substring in a string. The search is case-sensitive.
FIND( substring, string, [start_position] )
- instr – ArcGIS (see ESRI links above): Returns a Variant (Long) specifying the position of the first occurrence of one string within another.
InStr([start, ]string1, string2[, compare])
- concatenate – EXCEL: The Microsoft Excel CONCATENATE function allows you to join 2 or more strings together.
CONCATENATE( text1, [ text2, ... text_n ] )
- concatenate – ArcGIS: The ArcGIS CONCATENATE function allows you to join 2 or more strings together. Its syntax, however, is slightly different. Instead of the concatenate key word, use the & to field entries and text.
( [field1] & [field2] & "
text
" & ... )
- ucase: The Microsoft Excel UCASE function converts a string to all upper-case.
UCase( text )
- lcase: The Microsoft Excel LCASE function converts a string to lower-case.
LCase( text )
- replace – EXCEL: The Microsoft Excel REPLACE function replaces a sequence of characters in a string with another set of characters.
REPLACE( old_text, start, number_of_chars, new_text )
- replace – ArcGIS: The ArcGIS REPLACE function replaces a sequence of characters in a string with another set of characters.
REPLACE( old_text or [field], text_to_replace, new_text )
Week 8, Wednesday (Monday lecture continued…)
Monday, we made the following decisions about the net volume of growing-stock trees by Georgia county external EVALIDAtor table and the Census 2015 county GIS layer:
External table common ID:
The CID will be a combination of state and county FIPS. This value is contained in the first five characters of the text in the ‘County code and name’ field of the EVALIDator table. You need to:
- copy and paste the estimate into a new EXCEL spreadsheet
- rename the fields
- delete the Total record
- find all “-” and replace with 0 (<ctrl> H)
- format the numbers so thousands are NOT separated with a comma
- create a new field in the spreadsheet called evalidCID
- isolate the five left characters from the County code and name field and store in the new evalidCID column with the following:
=LEFT(A2,5)
- save this out as a CSV
Import and process your CSV
There were several ArcMap import issues with the CSV. When you open the CSV directly, ArcMap assumes your CID is numeric; we want it to be a text field. The easiest way to fix this is to:
- import the CSV into your project FGDB using the Import (single) tool, I called my new table ‘GSVol_26Sept16’
- ensure the numeric fields (Total, Public, Private) fields are imported as Long
- change the properties of the CID field (right-click on the field name >> properties)
– Type: Text
– Length: 10
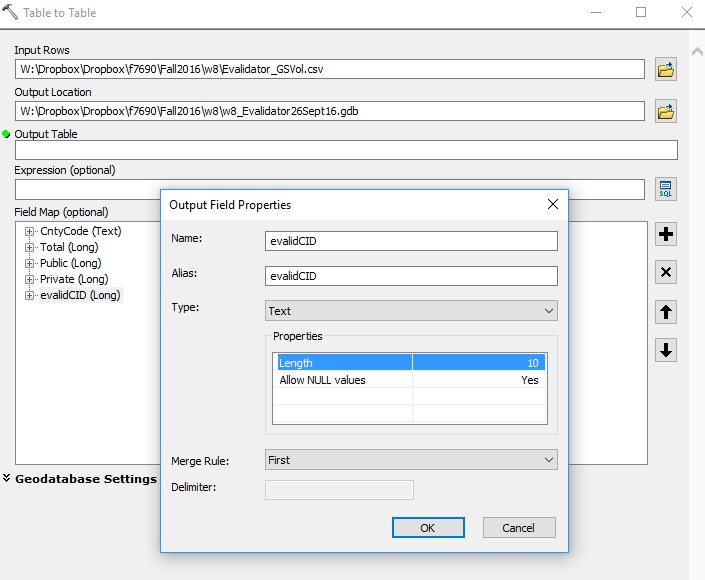
- upon import, open the table and make sure the numeric fields are numeric and the CID field is text
Census county boundary GIS layer common ID:
The state and county FIPS are stored in the GIS layer’s attribute table as ‘STATEFP’ and ‘COUNTYFP’. To combine these values into a new text field you create yourself (I called mine geocid):
- import the 2015 Census county boundary layer into your FGDB
- open the layer’s attribute table and unselect all records
- create a new text field to be
- right-click on your new field >> select Field Calculator >> enter the following
[STATEFP] & [COUNTYFP]
Taking inventory of what you have at this point
- a GIS feature class containing the 2015 Census county boundaries, each polygon has a unique identifier, geocid, created by concatenating the state and county FIPS code
- a table dataset containing the EVALIDator growing stock volume query results and a unique identifier, evalidCID, created using the mid command in EXCEL
Join the external table to the GIS data layer
This will be a one-to-one join where exactly one record matches exactly one feature in the feature class. The join is based on the geocid and evalidCID common fields. The steps are as follows:
- load the feature class (the polygon layer) and the table into your ArcMap project
- open the feature class’ attribute table >> table options >> joins and relates >> join
- drop-down 1: specify the feature class unique ID
- drop-down 2: specify the table
- drop-down 3: specify the table unique ID
- hit OK to initiate the join
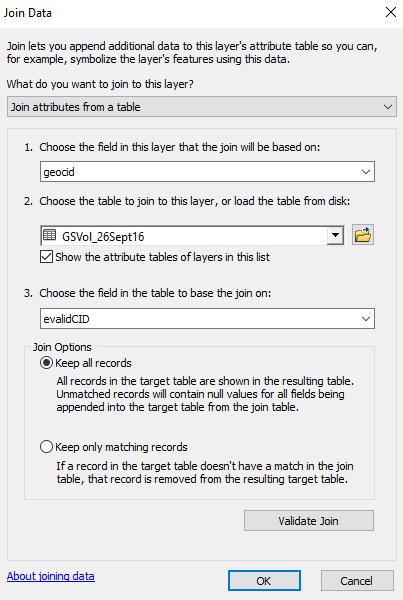
- open the feature class’ attribute table and verify that the Georgia counties have growing stock data attached
You can now symbolize (right-click >> properties >> symbology) the growing stock volume for each county using Quantities/Graduated Colors
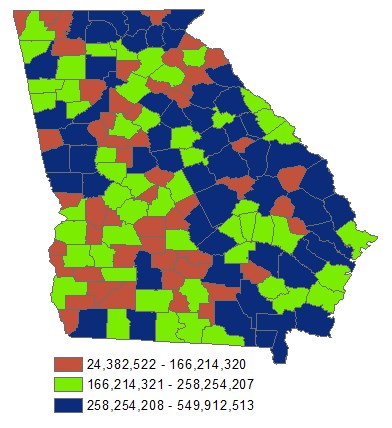
The EVALIDator reports 360,929,901 cubic feet of growing stock volume for Appling county and a sampling error of 20.22%. FIA presents sampling error in this form to facilitate 67% confidence intervals where the:
- lower bound (LB) on the estimate is 287,949,875 cubic feet of growing stock volume on timberland
(360929901 * (1 - 0.2022))
- upper bound (UB) on the estimate is 433,909,927 cubic feet of growing stock volume on timberland
(360929901 * (1 + 0.2022))
You can multiply the sampling error % by 1.95996 to convert to a 95% confidence interval, by 0.67449 for a 50% CI, by 2.17009 for a 97% CI, or by 2.57583 for a 99% CI)
KEEP IN MIND that this is only an estimate that is subject to statistical assumptions and interpretation. These results do not mean that if you harvested all of the growing stock volume in Appling county that you are guaranteed 360.9 million +/- 72.9 million cubic feet of wood.
This information gives us an idea of the magnitude of the error (sampling error %) and the likelihood of it happening (67% CI or 2 out of 3 times; 95% CI or 19 out of 20). Think about the FIA sampling error and confidence intervals this way:
... If you repeated this inventory of the same population across the same area using the same sampling methods over-and-over again, the expectation is that 67% of the time the 1 standard deviation confidence interval would contain the true mean, and 95% of the time the 2 standard deviation confidence interval would contain the true mean...