The Enhanced Forest Inventory and Analysis Program – National Sampling Design and Estimation Procedures (http://www.treesearch.fs.fed.us/pubs/20371)
- FIA standards: PDF page 24 (starting w/ last paragraph)
- Plot Layout: PDF page 39
- Derivation of population estimates: PDF page 53
- Sampling Error: PDF page 69
- Used by FIA to reflect the accuracy of the estimates
- Expressed as a percentage
- Computed by dividing the estimate into the square root of its variance
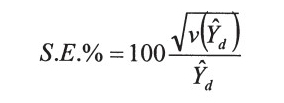
- Use to create 67% confidence interval
- Double sampling error value to approximate 95% CI
Forest Inventory and Analysis Database: Db Description and User Guide for Phase 2 (v 6.0.2)(http://www.fia.fs.fed.us/library/database-documentation/current/ver60/FIADB%20User%20Guide%20P2_6-0-2_final-opt.pdf)
Congress mandates that the sampling error for area cannot exceed 3 percent error per 1 million acres of timberland. A 5 percent (Eastern United States) or 10 percent (Western United States) error per 1 billion cubic feet of growing-stock trees on timberland is applied to volume, removals, and net annual growth. Unlike the mandated sampling error for area, sampling errors for volume, removals, and growth are only targets.

FIA inventories are extensive inventories that provide reliable estimates for large areas. As data are subdivided into smaller and smaller areas, such as a geographic unit or a county, the sampling errors increase and the reliability of the estimates goes down.
- Accuracy standards: PDF page 33
- 3% per million acres of timberland
- 5% per billion cubic feet of growing-stock trees on timberland
(Example) Continuous Forest Inventory report FIA (http://www.in.gov/dnr/forestry/files/fo-CFI_Report_2008-12.pdf)
- Page 7 starts a discussion of estimation errors
Forest Inventory and Analysis Program: Updates for Georgia’s Forest Land – 2013 FIA Data (http://www.gfc.state.ga.us/forest-management/private-forest-management/forest-inventory/FIAGAUpdate.pdf)
- Examples of how the data are graphed