ArcGIS Online –
(http://doc.arcgis.com/en/arcgis-online/reference/what-is-agol.htm)
‘ArcGIS Online is an online, collaborative web GIS that allows you to use, create, and share maps, scenes, apps, layers, analytics, and data…’ I find it a useful tool for sharing data and showing progress of work. It should be your go to tool if you ever need to create a web-based map or application. However, expect that all of your heavy lifting will be done on the desktop, not in the cloud.
I will step you through the process of:
- displaying already-uploaded spatial data (counties),
- uploading an external text file,
- performing a table join (join/link the data in the text file with the county boundary polygons), and
- analyzing the data based on fields in the attribute table and by each county’s attributes.
Step 0 – Authorizing your ArcGIS Online (AGOL) account
- Each of you should have an email in your inbox (or Trash Bin) from ESRI with instructions on how to set up your ArcGIS Online account. The email was sent to your uga.edu account (the account registered with ELC) on around August 9th. You need to open this email and follow their instructions to activate your AGOL account.
- Create a folder on the C:\ drive called week1agol. Make sure you save any data to this folder.
Step 1 – logging into AGOL & finding data
- Point your browser to (https://www.arcgis.com/home/signin.html) and enter your username and password to enter the ArcGIS Online site.

- Go to the Content dashboard (click the Content tab along the top left). This is the main dashboard from which you will import data and create your maps and AGOL Apps
- Create a new folder called FORS7690 – this is to help you organize your data sets
- Click the New icon in the Folders pane along the left
- Create a new map document in which you will display the USA counties and visualize the Ag Census data
- Click the Create icon and select New Map; enter the information below in the dialog that appears
- Title: Ag Census 2012
- Tags: FORS7690
- Summary: This is the document I created on the 2nd day of class.
- Save in Folder: FORS7690
- After you hit OK, you are presented with a map of the United States.
- Click the Create icon and select New Map; enter the information below in the dialog that appears
- I have already loaded a county data set to work with. Load it in your map by
- Click the Add icon and select Search for Layers
- Type “USACounties_FORS7690” in the Find: box and hit GO
- Click the “Add” link next to the layer in the results window and then hit “DONE ADDING LAYERS”

- Your USA map should now be overlain by a county boundary data layer. It should look something like what is shown below.

- Review this ESRI online document for an explanation of the map elements (buttons, widgets, legends, etc) you see on your AGOL map page.
- Create a new folder called FORS7690 – this is to help you organize your data sets
- Save your map.
Step 2 – Load your tabular data (the Ag Census data set I talked about Monday)
- I cleaned the Ag Census data set and have stored it in one of my DropBox folders HERE (click the link; click the ellipses in upper right; select download). You might notice that I replaced the NoData “-” with 0. Most of the time, this is not a good idea, but it was necessary for this demonstration.
- Save this file to your c:\week1agol\ folder
- The AGOL CSV upload process is fairly simple
- Add > Add Layer from File > browse to and select your file > hit the IMPORT LAYER button
- You are now looking at the Add CSV Layer dialog. Tick the box that says ‘None, add as table’, and hit ADD LAYER and YES, CONTINUE ADDING FEATURES

- You now have a text layer showing in the Contents panel. Click on the table icon to view its contents.

- Notice that the FIPS column was automatically converted to a numeric type. This is OK, we’ll work around it.
Step 3 – join the external data file (the CSV) to the spatial data (the county boundaries)
Tabular joins in GIS are a means to update the rather static spatial data, county boundaries don’t change very often, with more current information (county population, county officials, county budget, etc). These are the steps to join data layers
- Zoom so you can see the continental US
- Click the Analysis > Summarize Data > Join FeaturesI
- target layer: USACounties_FORS7690
- join to target layer: AgCensusOut_edit2_clean3
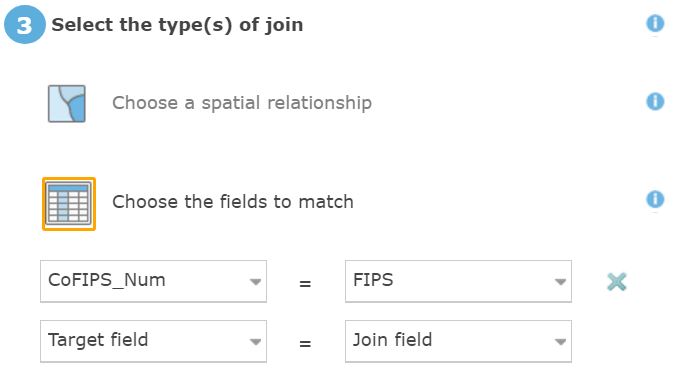
- type of join: ‘choose the fields to match’
- target field = CoFIPS_Num
- join field = FIPS
- join operation: join one to one
- result layer name: USACounties_FORS7690_AgCensus2012
- save result in: FORS7690
- UNTICK ‘Use current map extent’
- Hit RUN ANALYSIS to perform your join. Have a little patience. It took about 3 minutes when I worked through this yesterday evening.
- Open the table of USACounties_FORS7690_AgCensus2012 and scroll to the right. You should see the attribute information from the original county layer and the county’s Ag Census information for most counties. If a county does not have any Ag Census information, there is most likely a mismatch among the FIPS codes in the input data sets.
- Save your map.
Step 4 – style and analyze your data
Click on the Change Style button (triangle/square/circle button) below the USACounties_FORS7690_AgCensus2012 layer name and symbolize the counties based on the ‘AvGovMpts12’ field. Your map should look something like the insert below.
Save your map.
Other useful tools can be found under the Analysis button
- Spatial Summaries: Analysis > Summarize Data > Summarize Within
- Hot Spot: Analysis > Analyze Patterns
- Buffers: Analysis > Use Proximity
- Dissolve based on entries in a field: Analysis > Manage Data
- Overlay (topological) analyses: Analysis > Manage Data > Overlay Layers
Step 5 – share your map
You can share your map via a web link. Click the Share button (along the top of the screen), check the box next to ‘The University System of Georgia’, copy the ‘Link to this map’ link, and for now, hit DONE.