“If we have data, let’s look at data. If all we have are opinions, let’s go with mine.” – Jim Barksdale, former Netscape CEO
Data are the facts or details from which information is derived
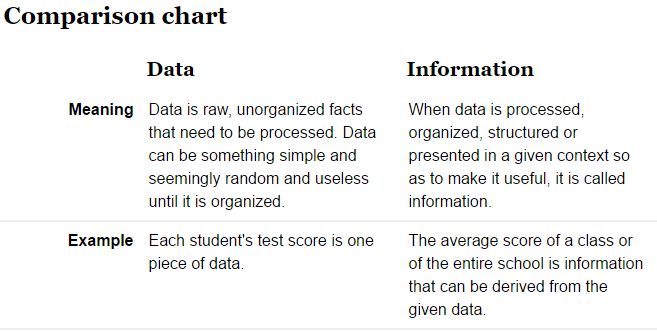
Throughout this course, know that we are combining data on the basis of location and individual attributes to form actionable information…
Data Compilation Example – 2017 Census of Agriculture (link)
The Census of Agriculture is a complete count of U.S. farms and ranches and the people who operate them. Even small plots of land – whether rural or urban – growing fruit, vegetables or some food animals count if $1,000 or more of such products were raised and sold, or normally would have been sold, during the Census year.
The Census of Agriculture, taken only once every five years, looks at land use and ownership, operator characteristics, production practices, income and expenditures. For America’s farmers and ranchers, the Census of Agriculture is their voice, their future, and their opportunity.
Frequently asked questions about the 2017 Census.
Georgia 2017 Census County Profiles (external link)
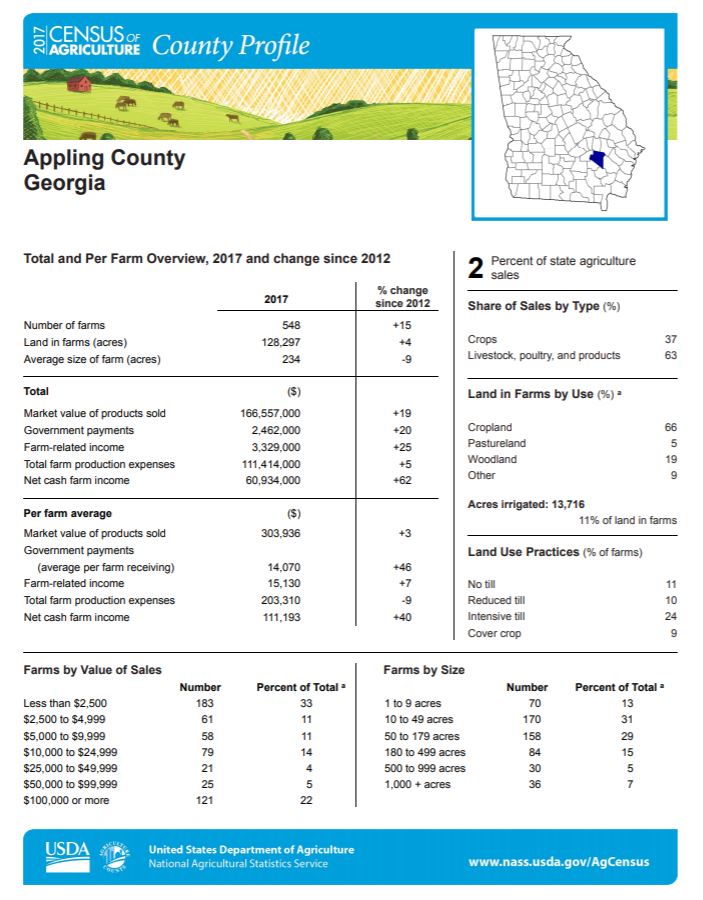
https://www.nass.usda.gov/Publications/AgCensus/2017/Online_Resources/County_Profiles/Georgia/cp13001.pdf
It is a trivial task to manually transcode the data for one county, but how long would it take to do this for the 159 counties in Georgia? What about for the 3,000+ counties in the US?
Using R to Process Tabular Data for the GIS – 2017 Census of Agriculture Example…
The USDA also provides FTP access to the 2002, 2007, 2012, and 2017 Ag Census data files here. Local access to the data provides us an opportunity to process “all of the data” at one time; we can generate custom queries and summaries that suit our individual needs, and we can even generate data tables to use inside our GIS. In the code example below, you will use R to 1) download and import the Ag Census data and 2) produce several simple simple data summaries. The following code relies on the dplyr library. This 4-part data wrangling with R tutorial provides an excellent description of how to use the dplyr library.
You only need to run this first bit of code once where you:
- download the Ag Census archives
- load the Ag Census archives and store as an R table
- save the R tables so you can use them later
#####=================================BEGIN 1
######RUN ONCE TO DOWNLOAD AND PREPARE Ag Census data for processing
######downlowd, convert, import US Census of Agriculture Data into R
#####
#####Specify my local working directory - change the path to YOUR working directory
setwd("U:/FORS7690/Fall2019/AgCensus2017/agricultureData-master/")
#####programmatically create two folders in which the data are downloaded and saved
dir.create("raw")
dir.create("rImported")

#####download data files from USDA FTP quickstats site ftp://ftp.nass.usda.gov/quickstats/

#####set my working directory to the 'raw' download folder and download files from FTP site
setwd("raw")
download.file("ftp://ftp.nass.usda.gov/quickstats/qs.census2002.txt.gz", "2002.txt.gz")
download.file("ftp://ftp.nass.usda.gov/quickstats/qs.census2007.txt.gz", "2007.txt.gz")
download.file("ftp://ftp.nass.usda.gov/quickstats/qs.census2012.txt.gz", "2012.txt.gz")
download.file("ftp://ftp.nass.usda.gov/quickstats/qs.census2017.txt.gz", "2017.txt.gz")

#####Uncompress files and load as a table object
cag2002 <- read.table(gzfile("2002.txt.gz"), sep="\t", header=TRUE)
cag2007 <- read.table(gzfile("2007.txt.gz"), sep="\t", header=TRUE)
cag2012 <- read.table(gzfile("2012.txt.gz"), sep="\t", header=TRUE)
cag2017 <- read.table(gzfile("2017.txt.gz"), sep="\t", header=TRUE)

#####Save save table objects to disk in the ../rImported directory
setwd("../rImported")
save(cag2002,file="cag2002.Rda")
save(cag2007,file="cag2007.Rda")
save(cag2012,file="cag2012.Rda")
save(cag2017,file="cag2017.Rda")
#####=================================END 1
Now that you have prepared the 2002, 2007, 2012, and 2017 Census of Ag data files, lets try to reproduce the 2017 Appling county summaries.
Appling county profile (2017):
- Number of Farms: 548
- Land in Farms (acres): 128,297
- Average Size of Farm (acres): 234
- Market Value of Products Sold: $166,557,000
- Average Per Farm: $303,936
- Government Payments: $2,462,000
- Average Per Farm Receiving Payments: $14,070
Copy and paste the next code segment into a new R script.
#####part 1
library(dplyr)
#####load previously-saved R data table
setwd("U:/FORS7690/Fall2019/AgCensus2017/agricultureData-master/rImported")
load(file="cag2017.Rda")
#####store R data table as a dplyr object
cag17<- tbl_df(cag2017)
#####list fields (attributes)
glimpse(cag17)

#####view a table showing the unique entries in the STATE_NAME field
uniqstates<- cag17 %>% count(STATE_NAME,sort=TRUE)
View(uniqstates)

############################################
#####We are only interested in Appling county, Georgia
#####Subset the 2017 dataset so it only contains the 229,964 Georgia entries
ga17<- cag17 %>% filter(STATE_NAME == "GEORGIA")
View(ga17)

#####You can filter on multiple attributes.  This time, refilter on the Georgis attribute and Appling attribute
appling_ga17<- cag17 %>% filter (STATE_NAME == "GEORGIA", COUNTY_NAME == "APPLING")
View(appling_ga17)

#####The above query yields 1,248 records.
#####Now we need to figure out what fields contain the information to fill in the county profile
#####From the county profile, We know that there are 548 farms and the values are stored in the VALUE field.  Lets create a temporary data set with only the Appling records whose VALUE = 548
tmp<- appling_ga17 %>% filter(VALUE == 548)
View(tmp)
#####Look at the COMMODITY_DESC and the SHORT_DESC entries.  You want the record where COMMODITY_DESC == "FARM OPERATIONS" and the SHORT_DESC == "FARM OPERATIONS - NUMBER OF OPERATIONS" and the DOMAIN_DESC == "TOTAL"
tmp2<- tmp %>% filter (COMMODITY_DESC == "FARM OPERATIONS", SHORT_DESC == "FARM OPERATIONS - NUMBER OF OPERATIONS", DOMAIN_DESC == "TOTAL")
#####Since this is only one value, use the SELECT call to store the value
numfarms_appling_ga17<- tmp2  %>% select(VALUE)

#####Or you can combine the FILTER and SELECT into one line...
numfarms_appling_ga17<- cag17 %>% filter (STATE_NAME == "GEORGIA", COUNTY_NAME == "APPLING", COMMODITY_DESC == "FARM OPERATIONS", SHORT_DESC == "FARM OPERATIONS - NUMBER OF OPERATIONS", DOMAIN_DESC == "TOTAL") %>% select(VALUE)
#####The variable numfarms_appling_ga17 is currently a list.  use the as.numeric function to convert it to a number
numfarms_appling_ga17<- (as.character(unlist(numfarms_appling_ga17)))
cat("Number of Farms: ", numfarms_appling_ga17)
Now, lets figure out how to select the correct entry for “Land in farms (acres)”. The following code will list all of the Appling county Georgia records.
#######################AT THE BOTTOM OF YOUR R SCRIPT...
#####Show all Appling county records:
appling_ga17<- cag17 %>% filter (STATE_NAME == "GEORGIA", COUNTY_NAME == "APPLING")
View(appling_ga17)
Notice the UNIT_DESC and DOMAIN_DESC fields. We are looking for (total) “Land in farms(acres)”. These fields contain values “ACRES” and “TOTAL” – exactly what you are looking for. Modify the above code:
#####part 2
#######################AT THE BOTTOM OF YOUR R SCRIPT...
#####Show all Appling county records relating to ACRES and TOTAL:
appling_ga17<- cag17 %>% filter (STATE_NAME == "GEORGIA", COUNTY_NAME == "APPLING", UNIT_DESC == "ACRES", DOMAIN_DESC == "TOTAL")
View(appling_ga17)
#####Yields 173 entries

#####You are looking for the record where SHORT_DESC == "FARM OPERATIONS - ACRES OPERATED", so
appling_ga17<- cag17 %>% filter (STATE_NAME == "GEORGIA", COUNTY_NAME == "APPLING", UNIT_DESC == "ACRES", DOMAIN_DESC == "TOTAL", SHORT_DESC == "FARM OPERATIONS - ACRES OPERATED")
View(appling_ga17)

####The above returns 1 record and we are only interested in the VALUE field.  So...
farmacres_appling_ga17<- cag17 %>% filter (STATE_NAME == "GEORGIA", COUNTY_NAME == "APPLING", UNIT_DESC == "ACRES", DOMAIN_DESC == "TOTAL", SHORT_DESC == "FARM OPERATIONS - ACRES OPERATED") %>% select(VALUE)
farmacres_appling_ga17<- (as.character(unlist(farmacres_appling_ga17[[1]])))

cat("Number of Farms: ", numfarms_appling_ga17)
cat("Acres of Farms: ", farmacres_appling_ga17)
Now lets search for the entry containing the “Average size of farm (acres)”…
#####part 3
#####show all Appling records
appling_ga17<- cag17 %>% filter (STATE_NAME == "GEORGIA", COUNTY_NAME == "APPLING")
View(appling_ga17)
#####Yields 1,248 entries

#####summarize the unique entries in UNIT_DESC
appling_ga17 %>% count(UNIT_DESC)

#####We're looking for UNIT_DESC == "ACRES / OPERATION"
appling_ga17<- cag17 %>% filter (STATE_NAME == "GEORGIA", COUNTY_NAME == "APPLING", UNIT_DESC == "ACRES / OPERATION")
View(appling_ga17)
#####Returns 8 records

#####Look to the SHORT_DESC field to determine the correct SHORT_DESC == "..."
avefarmsize_appling_ga17<- cag17 %>% filter (STATE_NAME == "GEORGIA", COUNTY_NAME == "APPLING", UNIT_DESC == "ACRES / OPERATION", SHORT_DESC == "FARM OPERATIONS - AREA OPERATED, MEASURED IN ACRES / OPERATION") %>% select(VALUE)
View(avefarmsize_appling_ga17)
avefarmsize_appling_ga17<- (unlist(as.character(avefarmsize_appling_ga17[[1]])))

cat("Number of Farms: ", numfarms_appling_ga17)
cat("Acres of Farms: ", farmacres_appling_ga17)
cat("Average Farm Size: ", avefarmsize_appling_ga17)
Now for “Market Value of Products Sold” which is presented in total dollars and “Average Per Farm” presented in dollars per acre… Follow the same approach as above.
#####part 4
#################################
#####Market value of products sold
#####show all Appling records
appling_ga17<- cag17 %>% filter (STATE_NAME == "GEORGIA", COUNTY_NAME == "APPLING")
View(appling_ga17)
#####Yields 1,248 entries

#####summarize the unique entries in UNIT_DESC
appling_ga17 %>% count(UNIT_DESC)

#####We're looking for UNIT_DESC == "$" OR UNIT_DESC == "$ / OPERATION"
#####NOTICE I changed the format of the query.
appling_ga17<- cag17 %>% filter (STATE_NAME == "GEORGIA" & COUNTY_NAME == "APPLING" & (UNIT_DESC == "$" | UNIT_DESC == "$ / OPERATION"))
View(appling_ga17)
#####Returns 120 records

#####I cheated here and found the VALUE that matches the "Market Value" listed in the Appling report ($166,557,000).  The following query returns the Appling county Market Value of Products Sold:
marketvalue_appling_ga17<- cag17 %>% filter (STATE_NAME == "GEORGIA" & COUNTY_NAME == "APPLING" & UNIT_DESC == "$" & SHORT_DESC == "COMMODITY TOTALS - SALES, MEASURED IN $" & DOMAIN_DESC == "TOTAL") %>% select(VALUE)
marketvalue_appling_ga17<- (unlist(as.character(marketvalue_appling_ga17[[1]])))

cat("Number of Farms: ", numfarms_appling_ga17)
cat("Acres of Farms: ", farmacres_appling_ga17)
cat("Average Farm Size: ", avefarmsize_appling_ga17)
cat("Market Value of Products Sold: ", marketvalue_appling_ga17)

#################################
#####Average per farm dollar value of products sold
#####I cheated here and found the VALUE that matches the "Average Per Farm:" listed in the Appling report ($303,936).  The following query returns the Appling county Market Value of Products Sold:
marketvalueperfarm_appling_ga17<- cag17 %>% filter (STATE_NAME == "GEORGIA" & COUNTY_NAME == "APPLING" & UNIT_DESC == "$ / OPERATION" & SHORT_DESC == "COMMODITY TOTALS - SALES, MEASURED IN $ / OPERATION" & DOMAIN_DESC == "TOTAL") %>% select(VALUE)
marketvalueperfarm_appling_ga17<- (unlist(as.character(marketvalueperfarm_appling_ga17[[1]])))

cat("Number of Farms: ", numfarms_appling_ga17)
cat("Acres of Farms: ", farmacres_appling_ga17)
cat("Average Farm Size: ", avefarmsize_appling_ga17)
cat("Market Value of Products Sold: ", marketvalue_appling_ga17)
cat("Average per Farm Market Value of Products Sold: ", marketvalueperfarm_appling_ga17)
Last, lets record the “Total Government Payments” and the “Average Per Farm Government Payments”. Again, I expedited the search for the proper query strings by sorting the appling_ga17 table based on the VALUE field and found the values for the total and per farm government payments.
#####part 5
#################################
#####Query string for the total government payments is:
#####(STATE_NAME == "GEORGIA" & COUNTY_NAME == "APPLING" & UNIT_DESC == "$" & SHORT_DESC == "GOVT PROGRAMS, FEDERAL - RECEIPTS, MEASURED IN $" & DOMAIN_DESC == "TOTAL")
govpayments_appling_ga17<- cag17 %>% filter (STATE_NAME == "GEORGIA" & COUNTY_NAME == "APPLING" & UNIT_DESC == "$" & SHORT_DESC == "GOVT PROGRAMS, FEDERAL - RECEIPTS, MEASURED IN $" & DOMAIN_DESC == "TOTAL") %>% select(VALUE)
govpayments_appling_ga17<- (unlist(as.character(govpayments_appling_ga17[[1]])))
#####Query string for the average per farm government payments is:
#####(STATE_NAME == "GEORGIA" & COUNTY_NAME == "APPLING" & UNIT_DESC == "$ / OPERATION" & SHORT_DESC == "GOVT PROGRAMS, FEDERAL - RECEIPTS, MEASURED IN $ / OPERATION" & DOMAIN_DESC == "TOTAL")
govpaymentsperfarm_appling_ga17<- cag17 %>% filter (STATE_NAME == "GEORGIA" & COUNTY_NAME == "APPLING" & UNIT_DESC == "$ / OPERATION" & SHORT_DESC == "GOVT PROGRAMS, FEDERAL - RECEIPTS, MEASURED IN $ / OPERATION" & DOMAIN_DESC == "TOTAL") %>% select(VALUE)
govpaymentsperfarm_appling_ga17<- (unlist(as.character(govpaymentsperfarm_appling_ga17[[1]])))
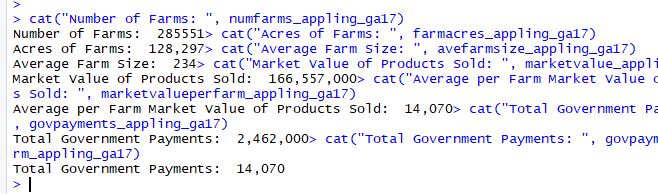
cat("Number of Farms: ", numfarms_appling_ga17)
cat("Acres of Farms: ", farmacres_appling_ga17)
cat("Average Farm Size: ", avefarmsize_appling_ga17)
cat("Market Value of Products Sold: ", marketvalue_appling_ga17)
cat("Average per Farm Market Value of Products Sold: ", marketvalueperfarm_appling_ga17)
cat("Total Government Payments: ", govpayments_appling_ga17)
cat("Total Government Payments: ", govpaymentsperfarm_appling_ga17)
At this point you have 7 variables to which 7 bits of data about Appling county are assigned (see screenshot of the cat output below). Seems like a lot of work for what we’ve got, right? It might be if you only wanted information about Appling county. What if you want this information for ALL counties in the USA?
Census county boundaries (2017)
Next step, data visualization
.