Forest Inventory and Analysis Program (FIA)
Background:  The Forest Inventory and Analysis (FIA) Program of the U.S. Forest Service provides the information needed to assess America's forests.

As the Nation's continuous forest census, our program projects how forests are likely to appear 10 to 50 years from now. This enables us to evaluate whether current forest management practices are sustainable in the long run and to assess whether current policies will allow the next generation to enjoy America's forests as we do today.

FIA reports on  status and trends in forest area and location; in the species, size, and health of trees; in total tree growth, mortality, and removals by harvest;  in wood production and utilization rates by various products; and in forest land ownership.

The Forest Service has significantly enhanced the FIA program by changing from a periodic survey to an annual survey, by increasing our capacity to analyze and publish data, and by expanding the scope of our data collection to include soil, under story vegetation, tree crown conditions, coarse woody debris, and lichen community composition on a subsample of our plots. The FIA program has also expanded to include the sampling of urban trees on all land use types in select cities.

FIA is managed by the Research and Development organization within the USDA Forest Service in cooperation with State and Private Forestry and National Forest Systems. FIA traces it's origin back to the McSweeney - McNary Forest Research Act of 1928 (P.L. 70-466). This law initiated the first inventories starting in 1930.
Forest Inventory and Analysis – Data and Tools (http://www.fia.fs.fed.us/tools-data/)
- EVALIDator: https://apps.fs.usda.gov/fiadb-api/evalidator
- FIA DataMart: https://apps.fs.usda.gov/fia/datamart/datamart.html
Use the EVALIDator to generate a report of area in forestland (in acres) for congressional districts in Georgia
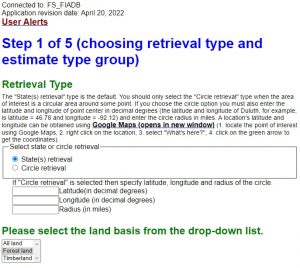
Step 1 you specify the geographic extent, land basis, and the estimation group in which you are interested.
- Use the ‘Circle retrieval’ if you need to generate estimates for a specific location (latitude/longitude/radius), otherwise, use the default ‘State retrieval’ option.
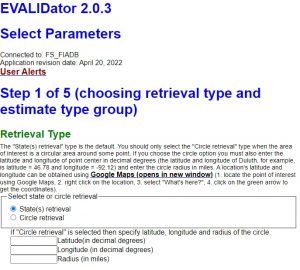
Figure 1. Select your retrieval type (page 1).
- Select your land basis, either Forest Land or Timberland. Forest land, according to the FIA Glossary, is land that has at least 10% crown cover or at least 10% canopy cover and is at least 1 acre and 120 feet wide. Tree-covered areas in agricultural production settings (fruit orchards) or tree-covered areas in urban settings (city parks), are not considered forest land. Timberland, on the other hand, is forest land that is producing or is capable of producing crops of industrial wood and are capable of producing in excess of 20 cubic feet per acre per year of industrial wood in natural stands (FIA Glossary https://www.nrs.fs.fed.us/fia/data-tools/state-reports/glossary/)
![]()
Figure 2. Select your land basis (page 1).
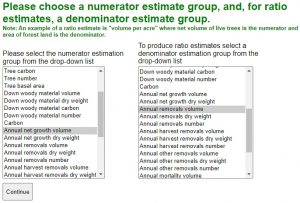
- Select your estimate group – this will be the estimate reported in the output table this query generates. You can, if desired, generate a ratio-based estimator such as volume/acre or growth/removals by selecting an entry in the denominator window. Otherwise, leave the “No denominator…” option selected for an estimate of the total.
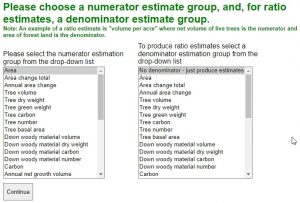
Figure 3. Select your estimate group (page 1).
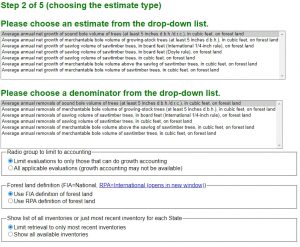
Step 2
- The options you have to select from on this screen depends on your Step 1 selections, so proceed carefully if you have multiple selections. In the last ‘Show list of all inventories…’ box, you limit the selections on the next page to the most current inventory for each state. If you use the top option, you will see one entry per state on the next screen. Selecting the bottom option will reveal all available inventories for each state.
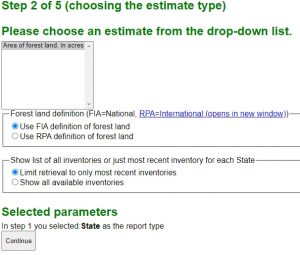
Figure 4. Select estimate type (page 2).
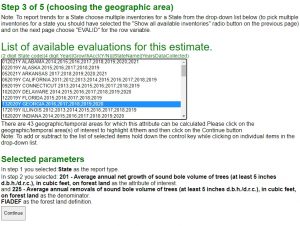
Step 3 select your geographic area and inventory.
- You can choose multiple evaluations by holding down <CTRL> and clicking on entries in the list. Make note of the years listed next to each state. These are the years the data used for this estimate were collected. In Figure 5, we see that this panel of data were collected in 2014 – 2018.
- This tool reports estimates based on this information as the “2018” estimate. Others prefer to present this estimate as ‘being based on data collected between 2014 and 2018’. Regardless of how you present this information, you must understand that we are generating an estimate of a resource that is continuously changing based on five-years worth of data.
- Imagine trying to generate an estimate of the UGA freshman class’ height by making measurements of 1/5 of the students in 2014, another 1/5 in 2015, …, and the remaining 1/5 in 2018. Can you really present this as the average height of the 2014 UGA freshman class? Or is it the 2018 class? Furthermore, the students measured in 2014 have grown, some of the students have withdrawn from school, and I am sure that there have been new students transfer in.
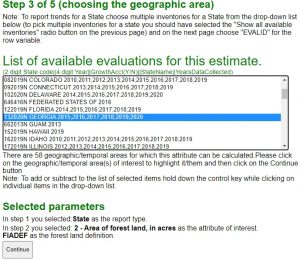
Figure 5. Select state parameter (page 3).
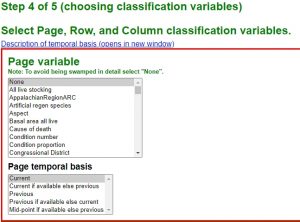
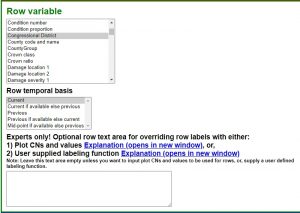
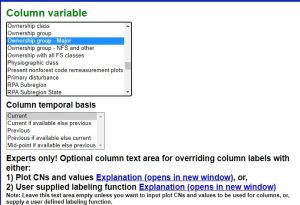
Step 4 select classification variables.
- This is when you design your output. If you consider your output an EXCEL spreadsheet, the Page variable controls the tabs along the bottom of the worksheet, the Row variable controls the row information, and the Column variable controls the column information. If your task is to display this information in the GIS, then your row variable must be one of the geographic variables like ‘Congressional District’ or ‘County code and name’.
- Your row and column options may differ slightly depending on the estimate you specify in earlier steps.
- Hit the Continue button to generate the table summaries.
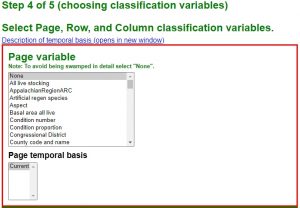
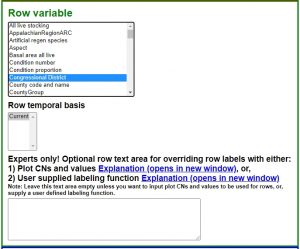
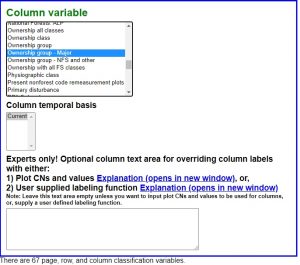
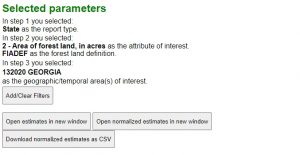
Figure 6. Indicate row/column variables (page 4).
———————————–
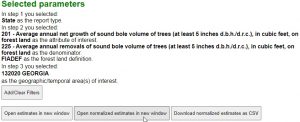
Use the EVALIDator to generate a report of the growth and removals by specie group and congressional districts in Georgia
Step 1 select your retrieval type and estimate group
- State retrieval & Forest land
We are interested in the ratio of growth to removals so, we select ‘Annual net growth volume’ as the numerator variable (in the left window) and ‘Annual removals volume’ as the denominator variable (in the right window)
Step 2 select the estimate type
- In this section you have the opportunity to select which “Annual net growth volume” estimate and which “Annual removals volume” estimate you require.
Step 3 select your geographic area and inventory.
- The options are the same as the previous query
Step 4 select classification variables.
- Want growth and removal summaries parsed by Congressional Districts (rows), Ownership group (columns)
Texas Forest Service Fact Sheet (w/ pretty good explanation of FIA sampling error)
- FIA Confidence interval refers to the two-out-of-three chance that the true population value is within the limits indicated.
- FIA Sampling error
- increases as the area or volume considered decreases in magnitude
- often unacceptably high for small geographic areas
Census cartographic boundaries download