The goal for this lab is three-fold. First, this one is easy, you will learn how to submit queries against the desktop version of the EVALIDator. Second, you will explore the relationship between the volume estimate, sampling error, and the area sampled - this one requires you to think. Finally, I would like you to evaluate the wood baskets for two prospective mill sites. I am sure you will pass this one with flying colors. Good luck. I highlighted the questions I would like you to answer (find them at the end of this document). Make sure you read the question before you attempt to answer.
NOTE: The web-based EVALIDATOR site is temporarily unavailable for maintenance for the next couple of weeks. Thus, we will start with the DataMart snapshot.
The following steps you through the basic FIA DataMart operations, then I give you a couple screen shots to help you with the Desktop EVALIDator MS Access
FIA DataMart
Links for your reference…
- EVALIDator web application: (http://apps.fs.fed.us/Evalidator/evalidator.jsp) – At this point, you should be familiar with this one
- Links to EVALIDator tutorial and documentation at the bottom of this page (http://www.fia.fs.fed.us/tools-data/tutorials_training/index.php)
- Links to FIA database documentation (http://www.fia.fs.fed.us/library/database-documentation/index.php)
- Forest Service Forest Inventory and Analysis home page: (http://www.fia.fs.fed.us/)
In addition to the web-based EVALIDator application, the Forest Service provides downloadable snapshots of the FIA database in MS Access (*.accdb) format; complete with an EVALIDator-like form from which you can easily submit the same queries but this time to a database stored on your local machine.
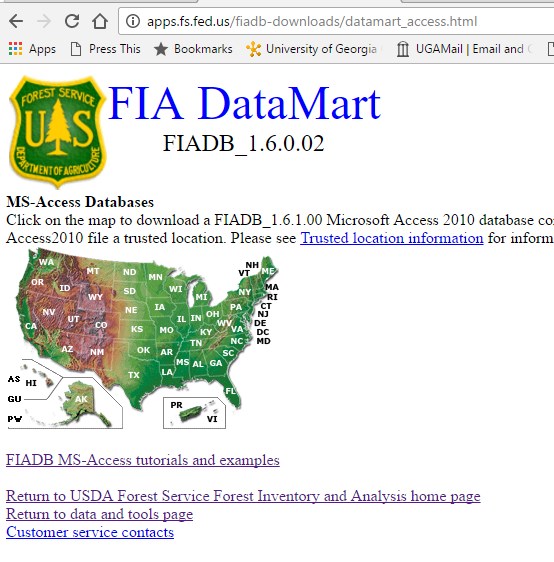
The URL for the FIA DataMart (figure 1) is https://apps.fs.usda.gov/fia/datamart/datamart_access.html. Click on the state you are interested in to download its most current database snapshot in MS Access 2010 format. The downloads are large so have a little patience. The Access database file is compressed so you must unzip after the download is completed. Also, you should review the Trusted Location Information page to enable the executable content in the Access database.
In this lab, I will give you just enough to do what you need to do. The tutorial and documentation page linked at the top of the page has a MS Access Basic Query refresher, and a couple EVALIDator tutorials you might find useful if you want to know more.
Desktop EVALIDator Basics
The following assumes you have downloaded the Georgia database snapshot, unzipped, and addressed the trusted location information issues…
Open EVALIDatorReports MS Access Form
Click the down-arrow & select ‘Forms’ >> 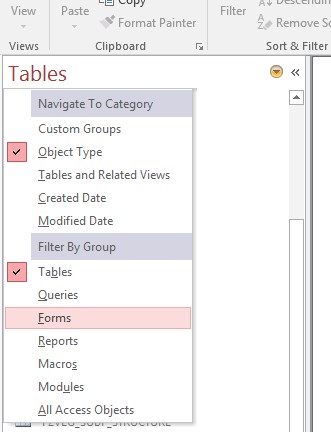
STEP 0
Update the MS Access Databases with most recently uploaded FIA data…
- Update files are downloaded here ( https://apps.fs.usda.gov/fia/datamart/CSV/datamart_csv.html )
- Download and extract the most recent zip file for your state (for Georgia, you download the “GEORGIA_GA.zip” file)
- Download and extract the most recent reference data. This is the first table on the page. Download the “All of the reference files zipped together” link.
- In the MS Access Forms section,
- Run “Load FIADB reference tables” (follow the prompt)
- Run “Load a State’s FIADB tables” (follow the prompt)
Your FIADB Access database is now updated with the most recently uploaded state files. You should make note of when you downloaded the files and when those CSVs were updated. You will report this information if you use the data in a report.
QUERYING THE DATABASE…
Double-click to run the EVALIDatorReports. The Step 1 and Step 2 inputs are for the most part the same as the web-based application.
STEP1
Select the estimate in which you are interested. For now, select “002 Area of timberland, in acres” for the Numerator and “000 Population estimate only” for the Denominator. Hit the Step1 button.
STEP 2
Specify the Row and Column variables, “County” and “Ownership”, respectively. Leave the Pages variable as “None”.
- If you want to add a filter or perform a query based on a single LAT/LON/RADIUS, hit the Add Filters button and specify your filters.
- You can also query a various inventory aggregations if you desire by selecting an entry in the “Eval ID” (the 3rd) window. The most recent aggregation will always be the last entry. Select the last entry in this box. In this case it is “33 131501 Georgia 2011.2012.2013.2014.2015”
Hit the Step 2 – Run button to submit the query.
If you need to start a new query, hit the Reset button.

When the query is complete, a save the output to your working directory with a .html extension and view the results in a web browser. At this point, you have an HTML page that is formatted exactly as the query results from the web-based EVALIDator. The estimates should look like this

and the sampling errors (reported on the same html below the estimates) should look like this
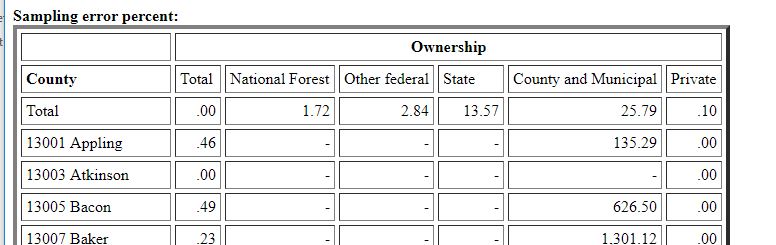
At this point in the process, you now have FIA database query results that you can copy/paste into a spreadsheet and format and then import into ArcMap or another statistical software package.
These are the questions I want you to address…(20 points total)
Download the Georgia FIA data from the Data Mart/
1. Submit queries to the Desktop EVALIDator for 1) net volume of live trees on timberland for Georgia counties by Ownership Group (Major) and for 2) total area of timberland for Georgia counties by Ownership Group (Major). When grading these, I typically group the answers into yes/good, almost, you tried, and what were you talking about and distribute the points accordingly. Your goal in answering these questions is to demonstrate to me you understand the concept or relationship. How long this takes is up to you; it might take 2 sentences or it might take a paragraph. Two queries, each with row variable = county, column variable = ownership group.
- Use the data from the first query and graph the sampling error (y-axis) from the net volume of live trees query versus the number of non-zero plots (x-axis) reported. Make an informed statement regarding the relationship between the number of non-zero FIA plots and the sampling error reported for this query. Use the graph to support your answer. (2 points)
- Use the data from the second query and graph the sampling error (y-axis) from the total area of timberland query versus the number of non-zero plots (x-axis). Make an informed statement regarding the relationship between the number of FIA plots and the sampling error reported for this query. Use the graph to support your answer. (2 points)
- Make one final graph showing the number number of non-zero plots from the 1st net volume of live trees query (y-axis) versus the area of timberland reported in the 2nd query (x-axis). Make an informed statement regarding the relationship between the number of FIA plots in a county and the area of timberland within the county. Use the graph to support your answer. (2 points)
- Make a unifying statement about the effect area sampled has on sampling error – in this case the area being sampled is timberland area in a county. (2 points)
2. You are contracted to perform a preliminary wood basket analysis of two proposed mill sites. The coordinates of the south Georgia site #1 are (LAT: 32.3792, LON: -83.0004) and the coordinates of the central Georgia site #2 are (LAT: 33.1168, LON: -83.8927). For each of these sites, submit the following queries filtered by LAT/LON and a 25/50/75/100 mile RADIUS – use Ownership as the rows variable and State as the columns variable:
- 003 Area of timberland, in acres
- 017 Net volume of live trees (at least 5 inches d.b.h./d.r.c.), in cubic feet, on timberland
- 028 Average annual net growth of live trees (at least 5 inches d.b.h./d.r.c.), in cubic feet, on timberland
- 042 Average annual removals of live trees (at least 5 inches d.b.h./d.r.c.), in cubic feet, on timberland
- You will submit 4, 75-mile radius queries for each site. Each query will generate an html result. Save each html result with a name that is unique and informative.
The clients are interested in only private timberland within these four procurement radiuses for each site. They have set a limit of 3% sampling error on timberland – an estimate whose error is above this is considered unstable. Use the query results to fill in the ‘week8_ExcelQueryAnalysisSheet.xlsx’. (6 points) Make a recommendation, either site #1 or site #2, and support it with the information you’ve compiled in the EXCEL worksheet. (4 point)
3. For 2 points,
- Restate the problem you attempted to solve through your analysis (or map)
- Re-report the results of your analyses
- Give me an example of how the analysis, either one of them, you just performed can be applied to an unrelated management problem or how a manager might use your map to address realistic management issues.