Background information (tables, file geodatabases, and shapefiles)
In this lab, you will:
-
create an event theme from a series of XY coordinate pairs stored in a data file,
-
convert between shapefile and file geodatabase file formats, you will
-
download a kml from qpublic, import it into arcmap, and then you will
-
make a map displaying the information you compile.
Tables (Excel, CSV, TXT)
You must format your tabular data correctly before importing into ArcMap. You must adhere to the following:
- First row contains field names, remaining rows contain data (if your data is in an Excel spreadsheet, row 1 are the field headers and rows 2 – n are your data)
- Field names:
- must begin with a letter a-z
- must be unique
- may only contain letters and numbers and underscores (“_”)
- may not contain spaces, dashes, or any other nonstandard characters
- should be as short as possible yet informative
- ArcGIS allows the following field types:
- text
- short integer (-32,768 to 32,767)
- long integer (-2,147,483,648 to 2,147,483,647)
- float or double (large negative and positive decimal number)
- Date (formatted date; difficult to deal with sometimes)
- When loading a data file, the first 8 rows of data determine the field type
- if there is a mix of data types (numbers and text), ArcGIS will import the field as a string
- if you need granular control over field types, import the data file into a file geodatabse
- You may not modify an Excel file while it is open in ArcMap. Best practice is to exit out of Excel before adding to ArcMap and/or exit out of ArcMap before opening in Excel.
- You may not modify an Excel file in ArcMap. You must make sure the data (and field names) are correct before loading into ArcMap.
- Each time after loading a table into a project, you should open it (right-click on the layer in the TOC >> Open) and verify the data were imported correctly.
Displaying tabular data as points on a map (Event Themes)
Field crews often store sample locations as a text file (*.csv, *.txt, *.xls, *.xlsx). To display these XY coordinates as points on your map, you must create an event theme. An event theme is simply a point layer created from coordinate pairs stored in a table.
Create your event theme by:
- load your data file into ArcMap
- right-click on the table >> display as XY (should now see your points in the map)
- save out as a feature in a file geodatabase or as a shapefile
- right-click on the event theme >> data >> export data >> ..
Before we go any further, A note about coordinate systems as they relate to event themes
You must know what coordinate system the XY coordinates were collected in. All GPS units, recreational grade through surveying grade, allow the user to specify a coordinate system (Lat/Long, UTM, and possibly State Plane). The coordinate system used is up to the one who is collecting the data. If you are not sure of the coordinate system used while collecting the GPS data you can view the metadata, ask the worker who collected the data or you can navigate to the location in Google Earth and compare the coordinates you have with the readings you see when you change the the display units (Tools >> Options >> 3D View tab >> Show Lat/Long window).
How to populate a file geodatabase
It is up to the user to decide if they’ll use a file geodatabase or a shapefile. To the Windows operating system, a file geodatabase looks like a normal folder with a “.gdb” extension.
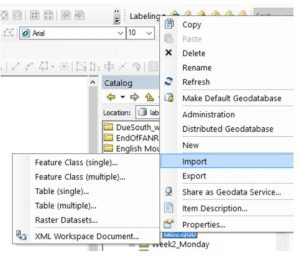
- Create a new, empty file geodatabase (from ArcMap/Catalog, right-click >> new >> file geodatabase)
- Import shapefile (from ArcMap/Catalog, right-click >> Import >> …)
- Feature class (single): 1 shapefile
- Feature class (multiple): > 1 shapefile
- Table (single): 1 table
- Table (multiple): > 1 table
- Raster Datasets: file geodatabases allow the user to store vector and raster
Export file geodatabase feature as shapefile
- From ArcMap/Catalog, right-click on feature class >> Export >> Shapefile
Shapefiles
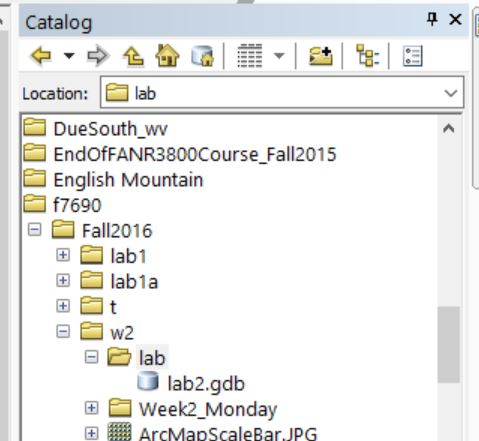
Carefully look at the screen shot below showing the ArcMap/Catalog listing. My working directory is ../f7690/Fall2016/w2/lab/… My file geodatabase, lab2.gdb, is stored in this directory. WHEN CREATING A NEW SHAPEFILE, !YOU MAY NOT! CREATE IT IN THE FILE GEODATABASE FOLDER. In this screen shot, I will right-click on the LAB folder to create my shapefile NOT THE LAB2.GDB folder!!!!
Create a new, empty shapefile:
- From ArcMap/Catalog, right-click on your working directory >> new >> shapefile
- Name your new shapefile, specify the feature type (point, line, or polygon), click the ‘edit’ button to set the coordinate system (for now, this will be given), hit OK
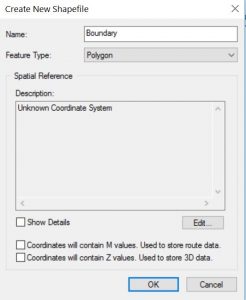
- Name your new shapefile, specify the feature type (point, line, or polygon), click the ‘edit’ button to set the coordinate system (for now, this will be given), hit OK
Background information (QPublic)
Most Georgia counties allow you to download their QPublic property boundaries as a Google KML.
If you are unsure of where to find the QPublic site for your county, Google it. Oconee county QPublic URL is http://www.qpublic.net/ga/oconee/search.html.
This is the typical QPublic interface for the counties in Georgia:

- You have an option to search by:
- Owner name
- Location address
- Parcel number/identifier
- Map browsing
- And others…
Example…
A landowner needs a map showing their boundary overlain on an aerial photograph. They live in Oconee county, GA and their parcel identifier is A 06 012
- From the QPublic web page
- Go to the Oconee county QPublic site
- Search by Parcel Number (A 06 012)
The search turned up 5 variations of “A 06 012”. Click the Map link to the right of the parcel ‘A 06 012’ owned by ‘The Marvin D. Green Land Trust’. You will see something like this
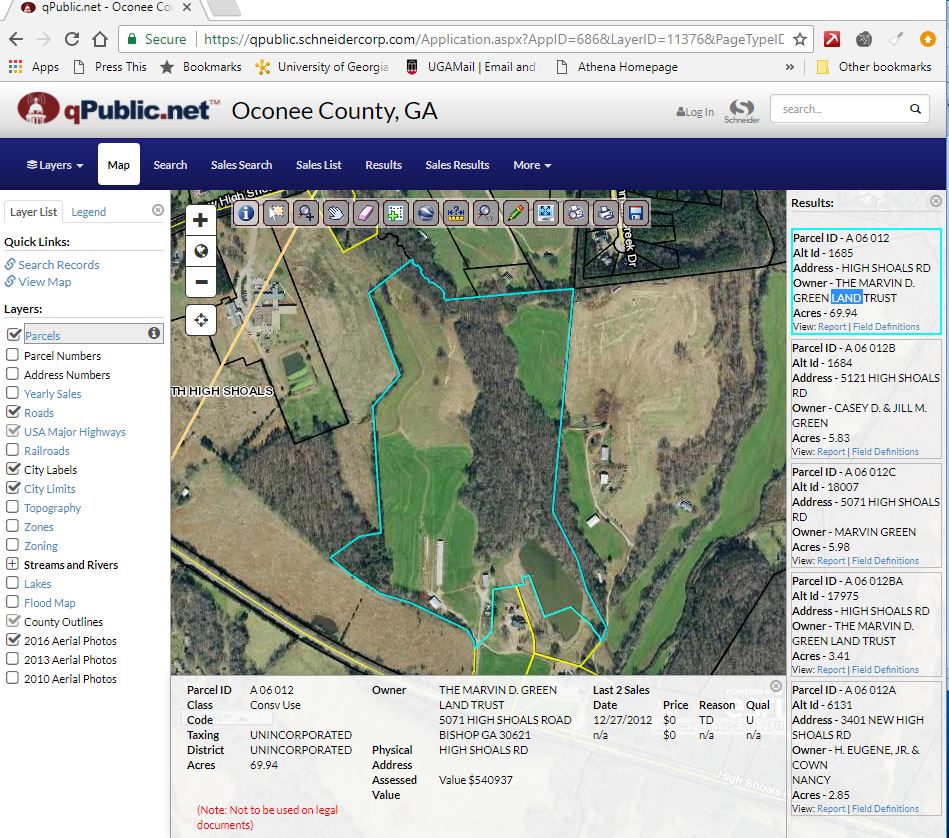
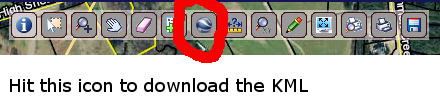
Download the property boundary KML using the blue marble icon (mane sure you save it into your lab2 working directory).
In ArcMap
- Open ArcToolbox (Geoprocessing PDM > ArcToolbox)
- Open the KML To Layer tool (ArcToolbox > Conversion tools > From KML > KML To Layer)
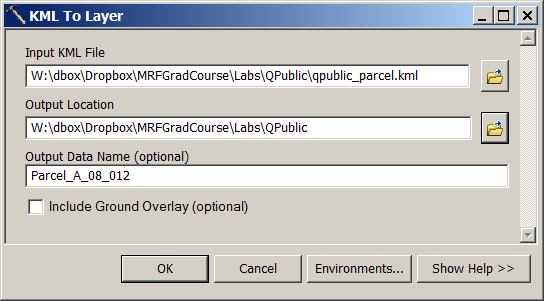
- Layer is loaded into the map document
- You might not see anything because the boundary is symbolized with a white outline. You will change that in just a minute
- From ArcMap/ArcToolbox >> Data Management Tools >> Features >> Feature to Polygon
For today’s lab (due next Thursday by midnight)
- create an event theme to display the information in the sample_sites.txt (linked here) data file
- contains both UTM (Zone 17), and Lat/Long (WGS83) XY Coordinates.
- save the event theme out as a shapefile named ‘samples_shapefile’
- import the shapefile into a file geodatabase (you create); call the feature class ‘samples_fc’
- import parcel A 06 012 from the Oconee county QPublic site; call this layer ‘site_boundary_qp’
- convert it to a polygon file geodatabase feature; call it ‘site_boundary_fc’
- convert the ‘site_boundary_fc’ to a shapefile; call it ‘site_boundary_shapefile’
- generate a map showing samples_shapefile, samples_fc, site_boundary_fc, site_boundary_shapefile;
- make sure you add a title, legend, scale text, scale bar, information text, north arrow